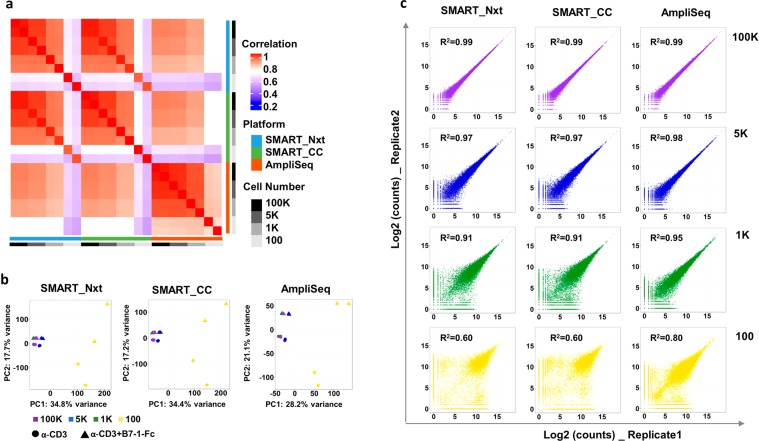
Figure 2.
Consistency between technical replicates was high at cell input equal to or above 1 K, and there was increased variability at 100 cell input. (a) Heatmap showing Pearson correlation of log2 transformed count values (Blue indicates low correlation and red indicates high correlation). Samples from α-CD3 + B7-1 Fc treatment are shown. (b) PCA plot show global expression pattern for sample in each cell gradient in each platform. Samples from both α-CD3 and α-CD3 + B7-1 Fc treatment are shown. (c) Scatter plots show correlation between the two replicates for each cell gradient in each platform. R2 indicates coefficient of determination. Samples from α-CD3 + B7-1 Fc treatment are shown.

