Figure 4.
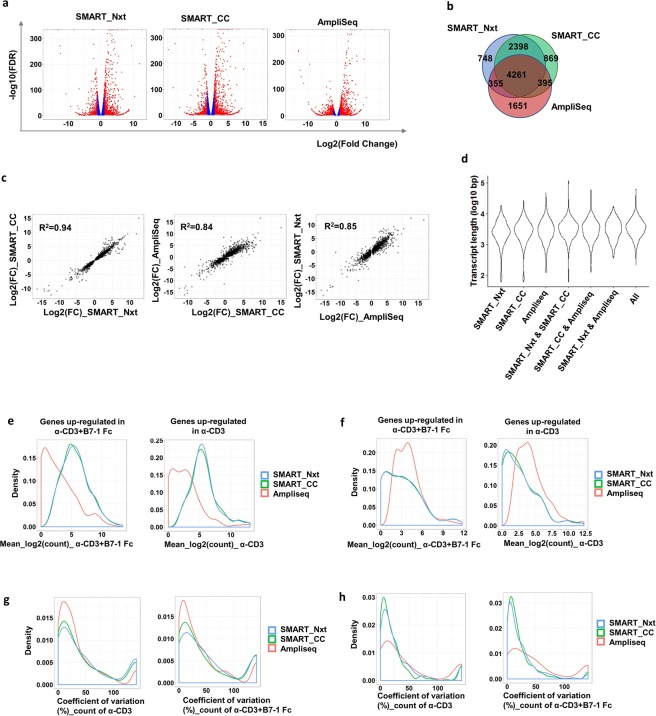
Three different platforms detected common differentially expressed genes; however platform specific detection was also observed. (a) Differential gene expression analysis for each platform. Red dots indicate genes with FDR < 0.05 and Fold change > = 2, blue dots indicate genes with FDR < 0.05 and Fold change < 2, grey dots indicate genes with FDR > 0.05. (b) Overlapping differentially expressed genes (FDR < 0.05) among platforms. (c) Scatterplots showing the log2 transformed fold change between each pair of the three platforms for the 4261 common DEGs. R2 indicates coefficient of determination. (d) Distribution of transcript lengths of the common and platform specific DEGs as in (b). (e) The distribution in expression of 2398 genes that were common for SMART_Nxt and SMART_CC (expression in α-CD3 + B7-1 Fc for genes up-regulated in α-CD3 + B7-1 Fc vs. α-CD3, and expression in α-CD3 for genes down-regulated in α-CD3 + B7-1 Fc vs. α-CD3). (f) Distribution of transcript lengths for AmpliSeq specific 1651genes. (g,h) The coefficient of variation (CV) between replicates for (g) SMART_Nxt and SMART_CC common DEGs and (h) AmpliSeq specific genes.

