Figure 5.
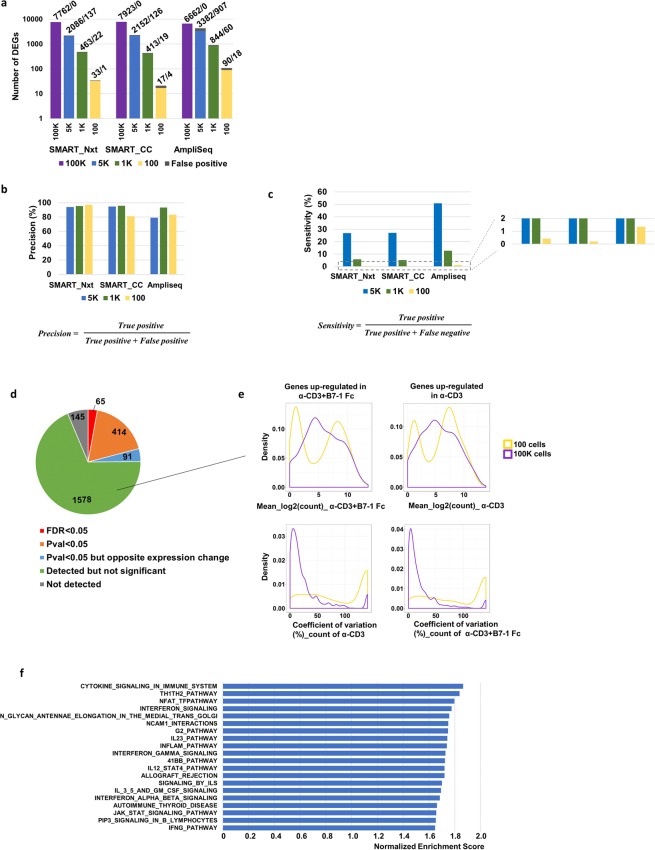
Number of differentially expressed genes decreased with reduced input, precision of detection stayed robust and AmpliSeq demonstrated greater sensitivity. (a) Number of DEGs between α-CD3 and α-CD3 + B7-1-Fc at 100 K, 5 K, 1 K and 100 cells input using Amplieq, SMART_Nxt and SMART_CC platforms (FDR < 0.05). Gray boxes indicate the DEGs not detected in 100 K cell samples (benchmark sample) but detected at low cell-number gradients (false positive hits). The absolute number of true positive and false positive detected genes were shown above each bar in the plot. (b) Precision for detecting DEGs at low input samples. (c) Sensitivity for detecting DEGs at low input samples. (d) Pie plot showing the differential expression analysis results for the DEGs detected in the 100 K samples (FDR < 0.05 and Fold change > 2) but not the 100 cell samples. (e) For the 1578 non-significant genes as in (d), density plots showing the mean log2 count and coefficient of variation between replicates for the 100 K cell samples and 100 cell samples. (f) Top 20 pathways enriched in α-CD3 + B7-1 Fc from the gene set enrichment analysis (GSEA) for the 100 cell sample. Bar plot shows the normalized enrichment score. All pathways passed the FDR < 0.25 as recommended by the GSEA team.

