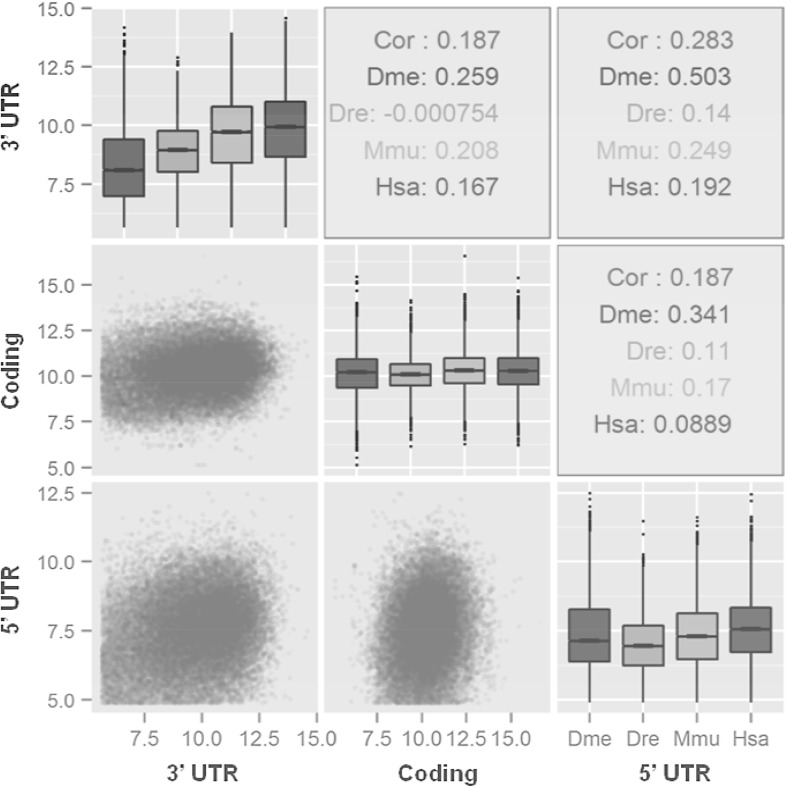
Fig. 1.
Length distributions and pairwise correlations among 3′ UTRs, coding regions and 5′ UTRs. First, length distributions for 3′ UTRs, coding regions and 5′ UTRs are demonstrated by Box-and-Whisker Plots along the diagonal in the figure, which are also filled by colours for representing different species. Second, the coloured points (lower triangle) graphically demonstrate pairwise comparisons. Third, species-specific Pearson’s coefficients of pairwise correlations are displayed in upper triangle. The lengths of UTRs and coding region (bp) are also log2 transformed for better graphical demonstrations. Throughout all figures, three-letter abbreviations of ‘Dme’ for fruit fly, ‘Dre’ for zebrafish, ‘Mmu’ for mouse and ‘Hsa’ for human are used

