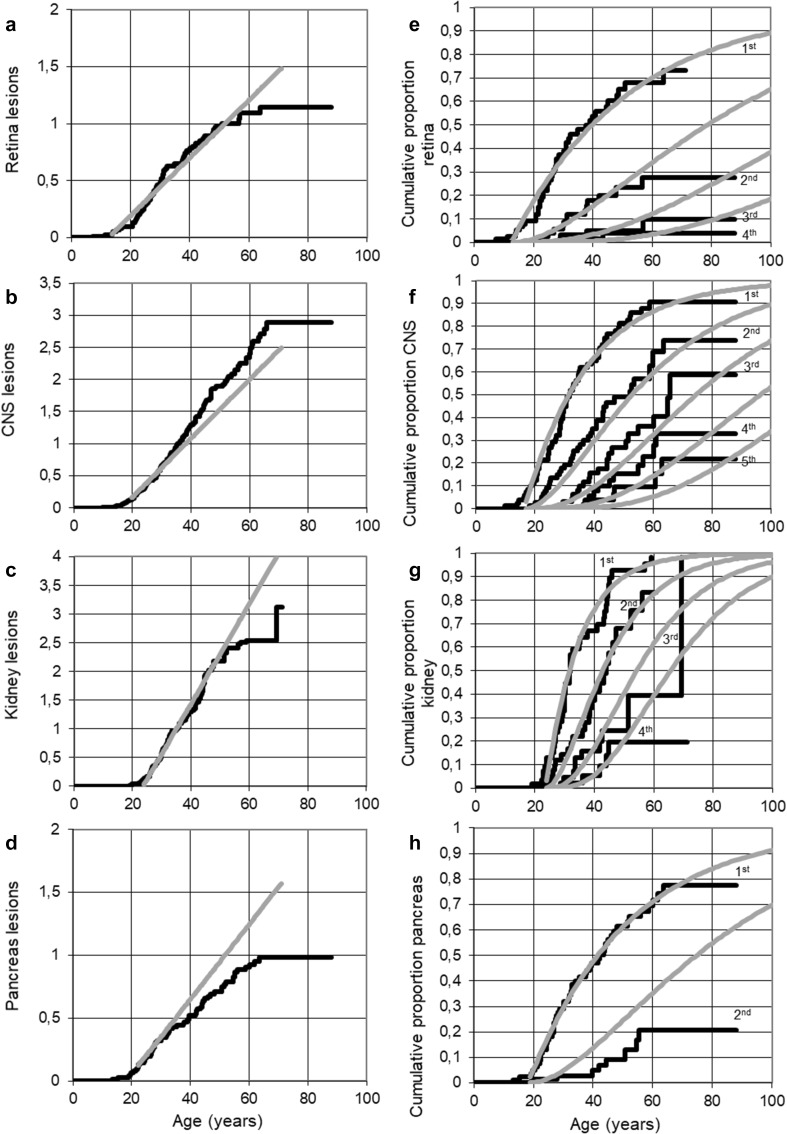
Fig. 1.
Predicted cumulative proportions of consecutive VHL-related manifestations for each organ (a, b, c, d) and Lifelong cumulative lesions in VHL mutations carriers during life (e, f, g, h) using the Poisson model (grey lines) compared to observed lesion counts during life (black lines) in retina, CNS, kidney and pancreas

