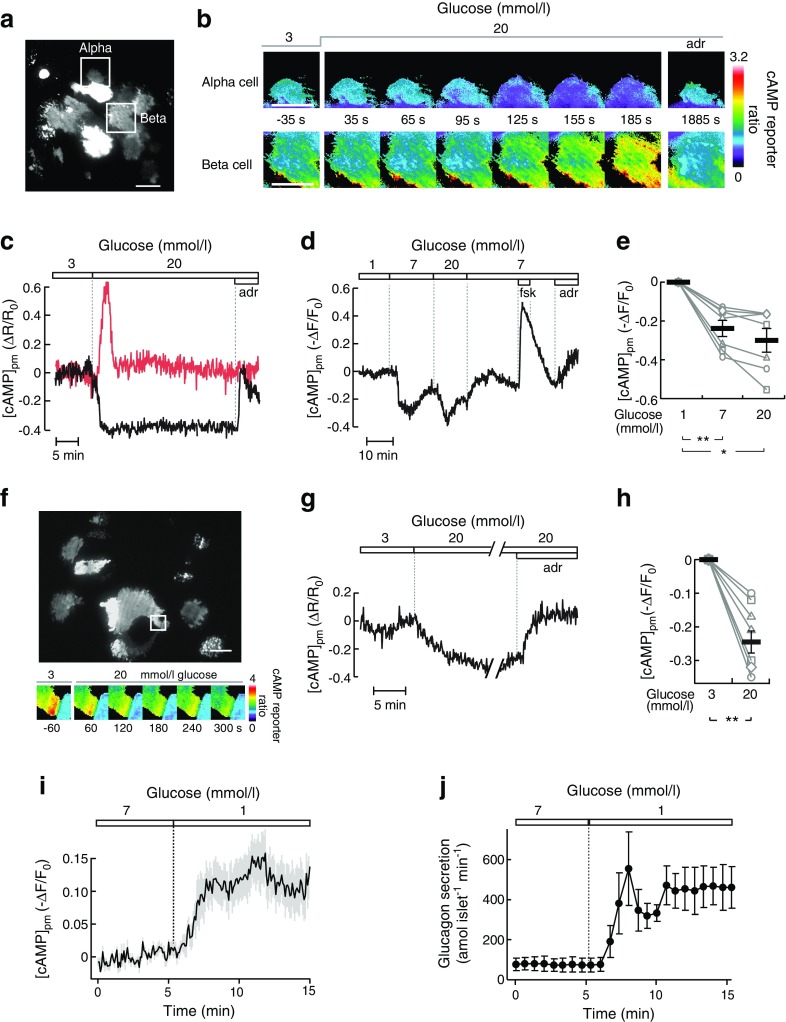
Fig. 1.
Glucose-induced modulation of [cAMP]pm in alpha cells parallels changes in glucagon secretion. (a) TIRF image of the cAMP reporter PKA-Cα-YFP expression in an intact mouse islet. The squares indicate an alpha cell and a beta cell from which [cAMP]pm was recorded. Scale bar, 10 μm. (b) Ratiometric TIRF images of the cAMP reporter in the alpha and beta cell highlighted in (a). Images were acquired at the indicated times in relation to an increase in the glucose concentration from 3 to 20 mmol/l as well as after applying 10 μmol/l adrenaline (adr). Reductions in the ratio correspond to lowering of [cAMP]pm and vice versa. (c) A ratiometric [cAMP]pm recording from the cells highlighted in (a) and (b). Glucose induced opposite changes in [cAMP]pm in alpha (black line) and beta (red line) cells, identified by their different responses to adrenaline. Changes in the fluorescence ratio (ΔR) have been normalised to the mean ratio during the initial 3 mmol/l glucose exposure (R0). Representative of five cells from three independent experiments. (d) [cAMP]pm responses in an alpha cell exposed to varying concentrations of glucose, 10 μmol/l forskolin (fsk) and 10 μmol/l adrenaline. The graph represents a single-wavelength recording with the fluorescence intensity changes inverted and normalised to the mean signal during the initial 1 mmol/l glucose exposure. Negative deflections of the curve thus correspond to decreases of [cAMP]pm and vice versa. Representative of seven cells from seven independent experiments. (e) Normalised [cAMP]pm levels at increasing glucose concentrations calculated from the seven cells exemplified in (d). Data points from each cell are represented with unique symbols connected with lines, together with mean (black horizontal bars) ± SEM for [cAMP]pm at each glucose concentration. (f) The large image shows the cAMP reporter PKA-Cα-YFP expression in an intact human islet imaged using TIRF microscopy. Scale bar, 10 μm. The square indicates a region with an alpha cell from which [cAMP]pm was recorded. The montage shows ratiometric TIRF images of the highlighted alpha cell at different time points in relation to an increase in glucose from 3 to 20 mmol/l. (g) Ratiometric [cAMP]pm recording from the human alpha cell highlighted in (f), showing a glucose-induced reduction and adrenaline-induced elevation of [cAMP]pm. After elevation of the glucose concentration, the recording was interrupted for approximately 20 min before the addition of adrenaline (10 μmol/l). Representative of seven alpha cell recordings from three islet donors. (h) Quantification of the glucose-induced [cAMP]pm response in seven human alpha cells from the recordings exemplified in (g). (i) [cAMP]pm response in mouse alpha cells exposed to a decrease in glucose from 7 to 1 mmol/l. The graph represents the mean of nine single-wavelength recordings ± SEM (grey) from four independent experiments, with the fluorescence intensity changes inverted (for positive correlation to [cAMP]pm) and normalised to the mean signal during the initial 7 mmol/l glucose exposure. (j) Kinetics of glucagon release from batches of perifused mouse islets exposed to a reduction in glucose from 7 to 1 mmol/l. Data are means ± SEM of three recordings from three different islet preparations. Statistical comparisons were made using paired Student’s t tests. *p < 0.05, **p < 0.01

