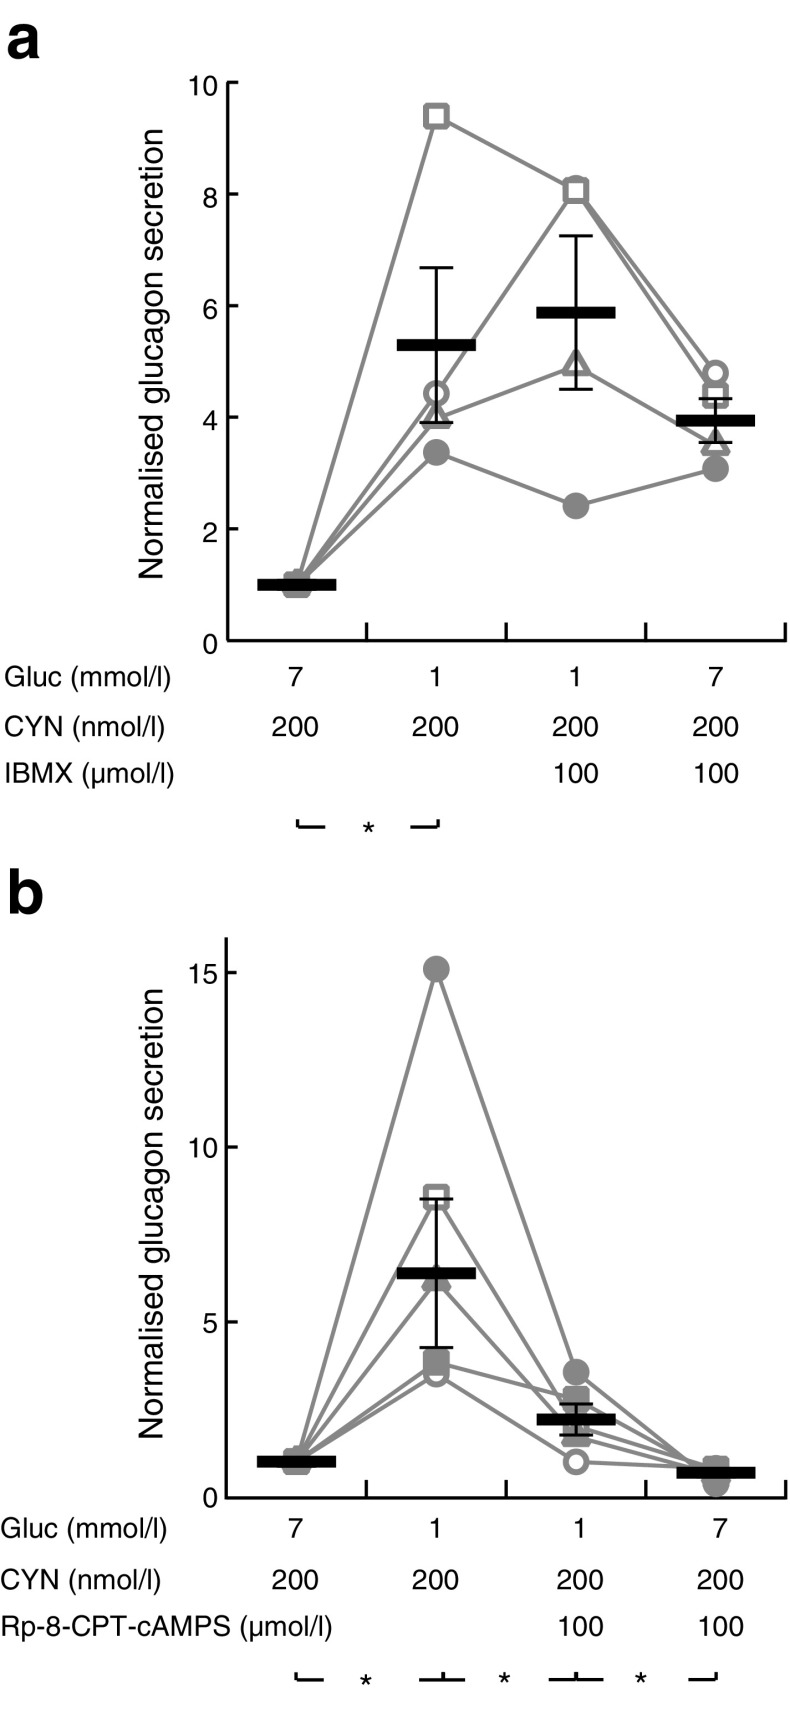
Fig. 6.
Phosphodiesterase inhibition prevents and PKA inhibition mimics glucose suppression of glucagon secretion. (a) Glucagon secretion from mouse islets sequentially exposed to different glucose concentrations and 100 μmol/l IBMX in the continuous presence of 200 nmol/l CYN 154806. Individual data points from four experiments are shown, together with means (black horizontal bars) ± SEM. (b) Similar recording showing the effect of different glucose concentrations and 100 μmol/l of the PKA inhibitor Rp-8-CPT-cAMPS in the presence of 200 nmol/l CYN 154806. Individual data points from five experiments are shown, together with means (black horizontal bars) ± SEM, normalised to the initial 7 mmol/l glucose, 200 nmol/l CYN, condition. Statistical comparisons were made using paired Student’s t tests. *p < 0.05

