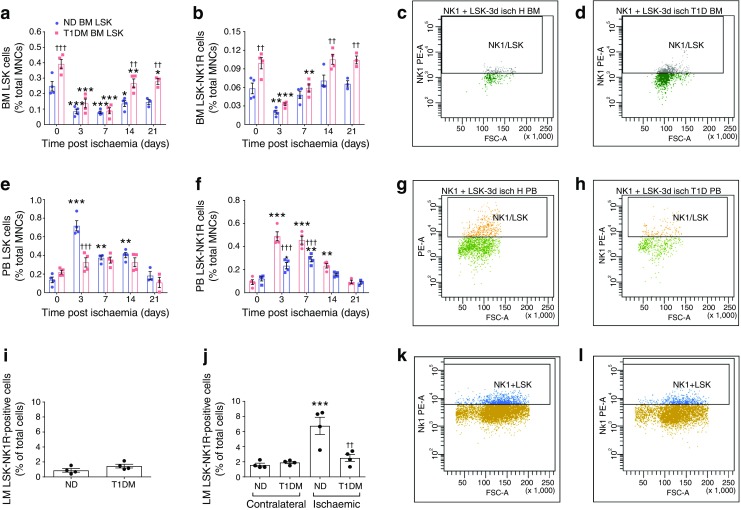
Fig. 6.

Impaired liberation and homing of nociceptor-expressing cells in type 1 diabetic mice subjected to unilateral limb ischaemia. (a–h) Flow cytometry analyses showing the abundance of LSK and LSK-NK1R cells in the bone marrow (a–d) and peripheral blood (e–h) of non-diabetic and type 1 diabetic mice before and after induction of limb ischaemia. Data are expressed as percentage of mononuclear cells. Representative images of gating performed on samples of bone marrow: (c) non-diabetic and (d) type 1 diabetic; and peripheral blood: (g) non-diabetic and (h) type 1 diabetic, collected at 3 days post limb ischaemia. n = 5 mice per group; *p < 0.05, **p < 0.01 and ***p < 0.001 vs time 0; ††p < 0.01 and †††p < 0.001 vs non-diabetic animals. (i–l) Flow cytometry analyses of LSK-NK1R cells in murine muscles. Bar graphs showing the levels of LSK-NK1R cells in normoperfused limb muscles from non-operated mice (i), and LSK-NK1R cells in contralateral and ischaemic limb muscles collected 3 days post limb ischaemia from non-diabetic and type 1 diabetic mice (j). Typical gates of flow cytometry analyses performed on ischaemic limb muscles from non-diabetic (k) and type 1 diabetic (l) mice. n = 4 per group. ***p < 0.001 vs contralateral; ††p < 0.01 vs non-diabetic. All data are expressed as means ± SEM. BM, bone marrow; FSC-A, forward scatter-area; LM, limb muscle; MNC, mononuclear cell; ND, non-diabetic; PB, peripheral blood; PE-A, phycoerythrin area; T1DM, type 1 diabetic
