Fig. 2.
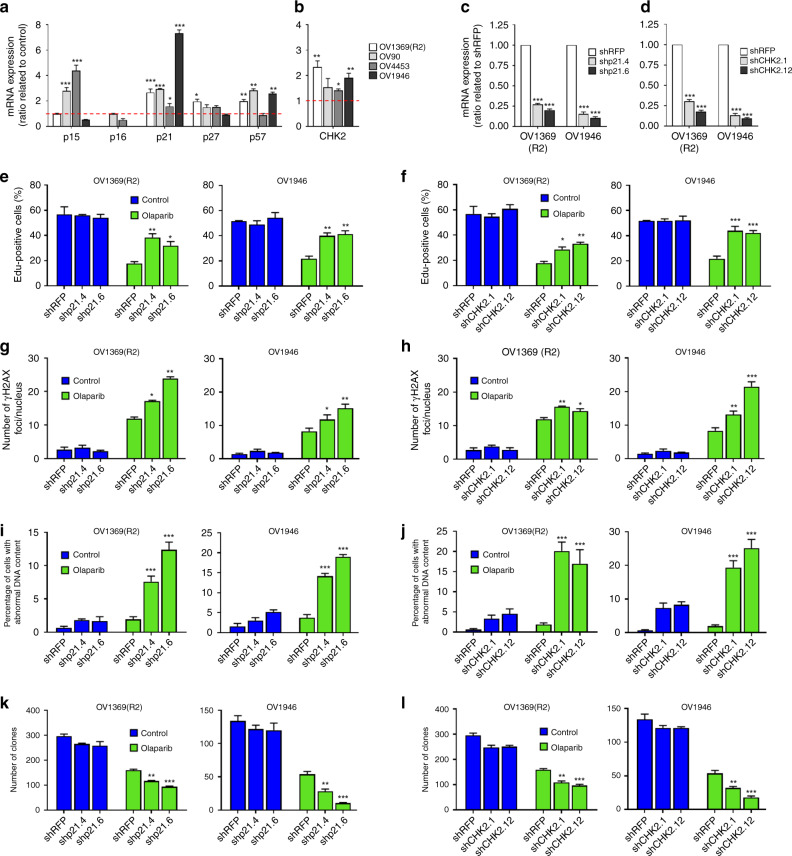
Involvement of p21 and Chk2 in Olaparib-induced senescence. a, b Relative mRNA levels of p15, p16, p21, p27, and p57 (a) or Chk2 (b) evaluated by real-time Q-PCR in HGSOC cells treated with Olaparib IC50 concentrations for 6 days. The values represent the fold change expression related to nontreated controls. c, d Real-time Q-PCR showing gene silencing by shRNA against p21 (c) or Chk2 (d) in HGSOC cells. e, f Analysis of 8-h EdU pulse after 6 days exposure of shp21 (e) or shChk2 (f) infected HGSOC cells to Olaparib IC50 concentrations. g, h Number of γ-H2AX foci per nucleus in shp21 (g) or shChk2 (h) infected HGSOC cells treated with Olaparib IC50 concentrations for 6 days were determined by analyzing >150 cells per condition. i–j Flow cytometry analysis of DNA content following 6 days exposure of shp21 (i) or shChk2 (j) infected HGSOC cells to Olaparib IC50 concentrations. k, l Clonogenic assays were performed on shp21 (k) or shChk2 (l) infected HGSOC cells treated or not with Olaparib IC50 concentrations for 6 days. For all the data, the mean ± SEM of three independent experiments is shown. Data were analyzed using the two-tail Student t test. *Denotes p < 0.05, **p < 0.01, and ***p < 0.001

