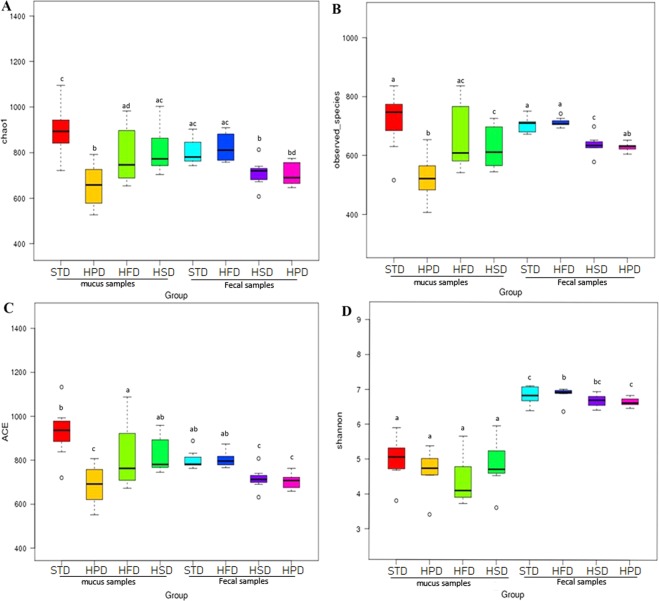
Figure 4.
Box plot of alpha diversity showing differences between each other group. (A) Chao1 index (B) The observed species (C) ACE index (D) Shannon index. The letters a, b, c and d are used to clarify whether the difference between any pair of groups calculated by Wilcoxon analysis was statistically significant (p < 0.05), and there was a significant difference in flora diversity between the two groups sharing no common letter markers.

