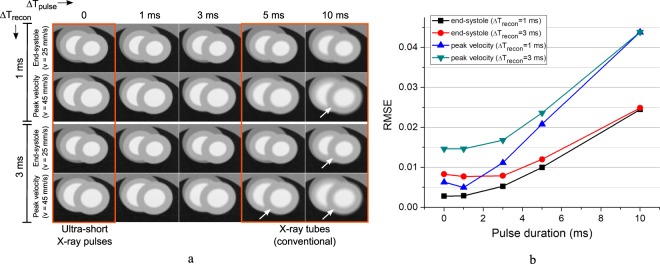
Figure 4.
Noiseless simulation showing the motion blurring for different duration of the reconstruction window ΔTrecon and the X-ray pulse ΔTpulse, reconstructed at end-systole (v = 25 mm/s) and at time of peak myocardial velocity (v = 45 mm/s). (a) Reconstructed images in the transaxial plane (xy); the white arrows indicate settings leading to non negligible motion blurring. All images have been reconstructed by FBP with a voxel size of 100 μm from 240 projections per cardiac phase, taken at 1.5° sampling interval. (b) RMSE analysis relative to a reconstruction of the same ROI otained with a fixed reconstruction window of negligible duration, ΔTrecon = 1 μs (reference image not shown).

