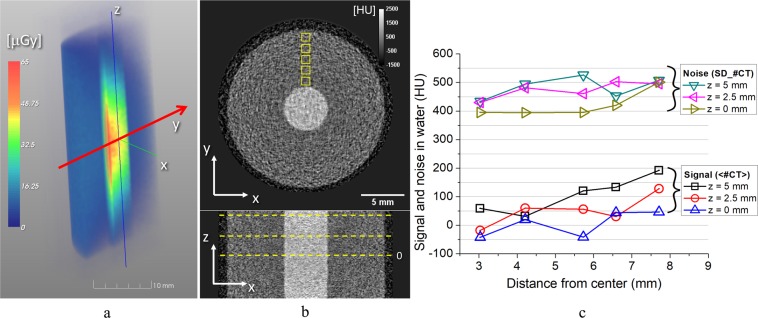
Figure 5.
(a) Volume rendering of the 3D distribution of the X-ray dose delivered by a single laser shot to the water phantom with iodine insert (see text). For visualization purposes, a virtual cutting on the yz plane has been made on this rendering. The red arrow (y axis) shows the main direction of propagation of the X-ray beam for the selected laser shot. (b) Transverse (top) and coronal (bottom) slices of the tomographic reconstruction of the same phantom in (a). All images are reconstructed with a SIRT algorithm, 300 iterations, and with an isotropic voxel of 100 μm. (c) Average reconstructed values (signal) and noise in water at several radial and axial positions. The radial positions of the ROI’s are depicted as yellow squares in (b), whereas the axial positions are shown as dashed lines in the coronal image (only z = 0 is marked).

