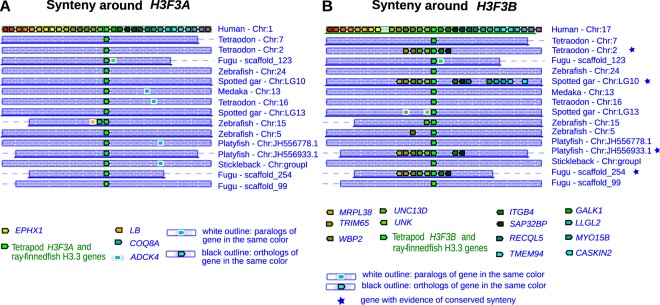
Figure 2.
Synteny around H3F3A and H3F3B genes. (A,B) Synteny conservation analysis around human H3F3A (A) and H3F3B (B) genes performed using selected actinopterygian genomes. Human H3F3A and H3F3B and actinopterygian H3.3 are placed at the center of each plot (green block). A black outline represents an ortholog of a gene in the same color, while a white outline represents a paralog of a gene in the same color. A blue star indicates an actinopterygian organisms in which syntenic genes around the H3.3 gene are also conserved around the human H3.3 gene.

