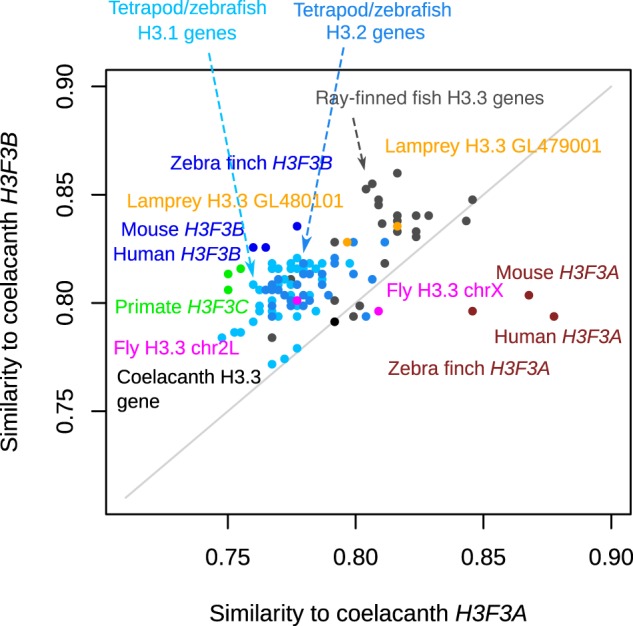
Figure 3.

Comparison of coelacanth H3.3 genes to related genes in sarcopterygian and non-sarcopterygian lineages. Sequence similarity was estimated for the CDS of coelacanth H3.3 genes (H3F3A, x-axis and H3F3B, y-axis) and CDS of H3.3 genes from other sarcopterygian and more distant organisms (actinopterygians, lamprey, fly). Additionally, CDS of tetrapod and zebrafish H3.1 and H3.2 genes were included in this analysis. Each point represents a gene and the organism name is written in the matching color. The sequence similarity represents the percentage of the identical nucleotides in the sequence.
