Figure 4.

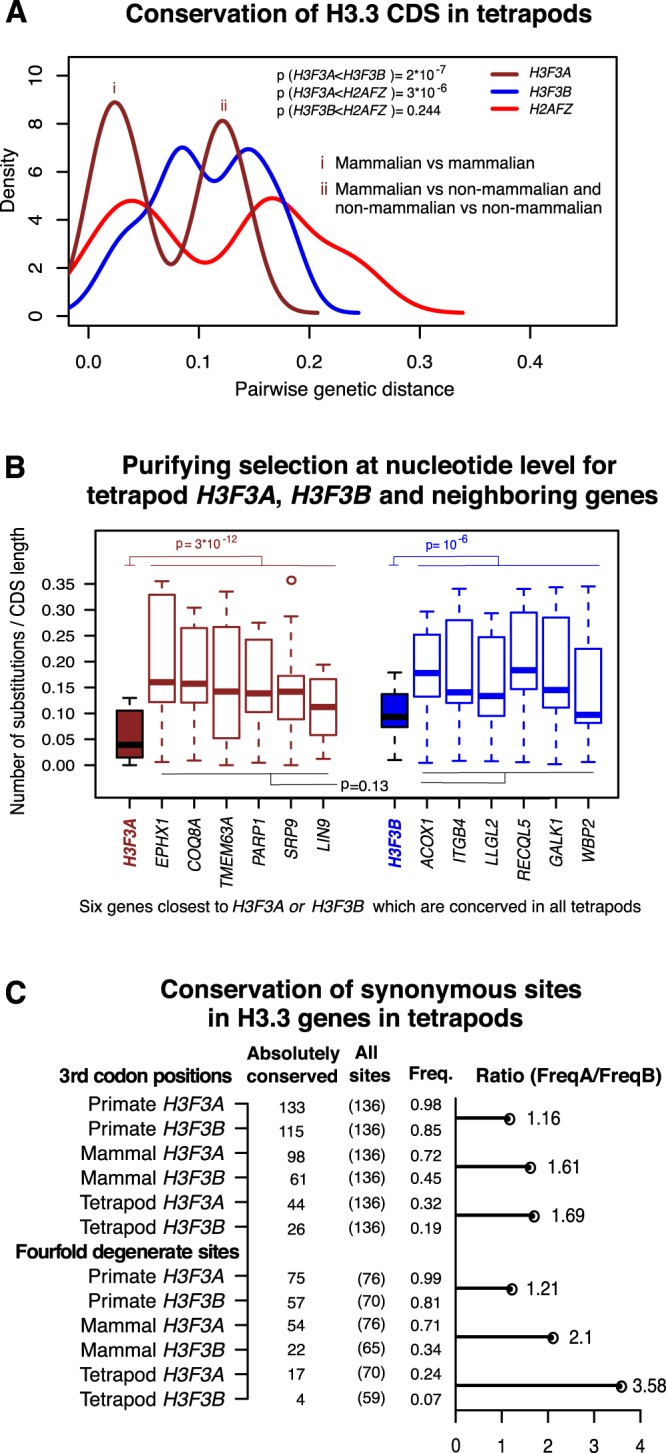
Conservation of coding sequences in tetrapod histone variant genes. (A) Pairwise nucleotide substitution scores (genetic distances) computed for two H3.3 genes (H3F3A, brown and H3F3B, blue), and H2AFZ gene (red) which was included in this analysis for comparison. The analysis was performed for tetrapod genomes. Distribution shifting to the left (smaller genetic distances) indicates higher conservation of the corresponding gene. “i” marks the peak of the bimodal distribution corresponding to the pairwise comparisons involving only mammalian organisms, while “ii” marks the peak corresponding to the pairwise comparisons involving mammalian and non-mammalian organisms as well as comparisons of non-mammalian organisms to each other. (B) Pairwise nucleotide substitution scores for H3F3A in tetrapod genomes (box plot filled in brown), H3F3B in tetrapod genomes (filled in blue), and their neighboring genes (brown and blue borders respectively). Both H3F3A and H3F3B are significantly highly conserved relative to their surrounding genes (Wilcox sum rank test P = 2.9 * 10−12 and P = 10−6 respectively). No significant difference in conservation level between genes around H3F3A and those around H3F3B (P = 0.13). (C) Absolute nucleotide conservation in CDS of the H3.3 genes in tetrapod lineages. Top panel: all 3rd codon position; bottom panel: the fourfold degenerate sites (i.e. sites where any possible nucleotide substitution is synonymous). Columns show the number of absolutely conserved sites for a given group of organisms, the total number of 3rd codon positions or fourfold degenerate sites, and the corresponding frequencies of absolutely conserved sites. The horizontal bar represents the H3F3A/H3F3B over-representation of absolutely conserved sites.
