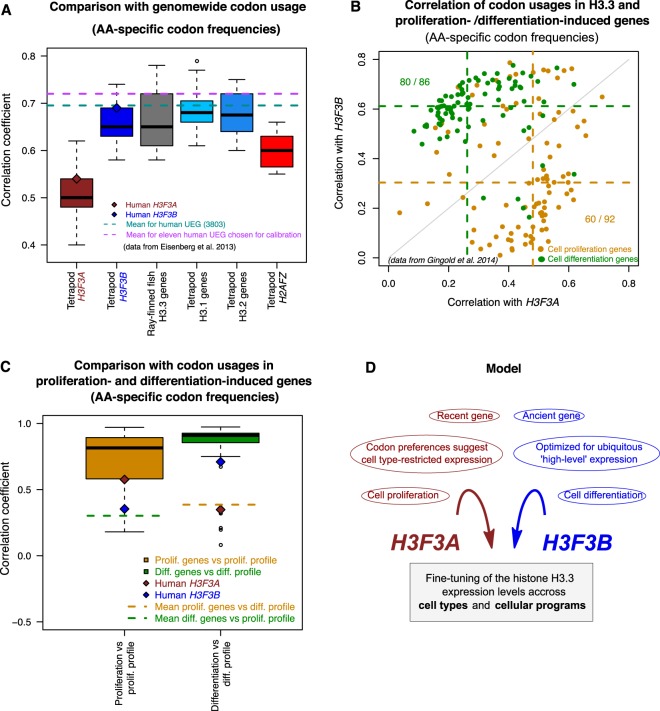
Figure 5.
Distinct codon usage preferences in the H3.3 genes (based on ‘amino-acid specific codon frequencies’). (A) Correlation between codon usage in the genes specified at x-axis and the genome-wide codon usage. The box plots represent the lineage distributions of correlation coefficients calculated for the ‘amino-acid specific codon frequencies’ of a corresponding gene with those estimated genome-wide (e.g. all tetrapod H3F3A genes vs. genome-wide frequencies). The brown and blue diamonds provide reference for human H3F3A and H3F3B respectively. The dashed cyan and magenta lines represent average correlations computed for the full set of human ubiquitously expressed genes (UEG; cyan) and a subset of these genes that have been proposed for calibration due to their highly uniform and strong expression across human cell types (magenta)46. (B) Correlation of human H3F3A and H3F3B codon usage frequencies with those computed for the genes associated with cell proliferation (orange) and cell differentiation (green)43. Each dot represents an individual gene from the corresponding group. The dotted lines indicate the correlation coefficient medians for each group and the H3.3 gene. (C) Benchmarking of the codon usage frequencies in the H3.3 genes relative to the frequencies estimated for the genes from the cell proliferation and differentiation groups. Boxplots represent correlation values for the amino-acid specific codon frequencies of individual cell proliferation genes or cell differentiation genes with the overall profiles estimated for their respective groups. Dashed lines show the mean values of the correlations of individual genes from one group with the opposite group profile (e.g. mean for the correlations of the codon usages of the proliferation genes with the overall differentiation profile). The brown and blue diamonds indicate correlation values for the human H3F3A and H3F3B genes. (D) A model illustrating the possible role of the evolutionary conserved arrangement of the two genes (H3F3A and H3F3B) encoding the same protein (H3.3) in fine-tuning of this protein expression.

