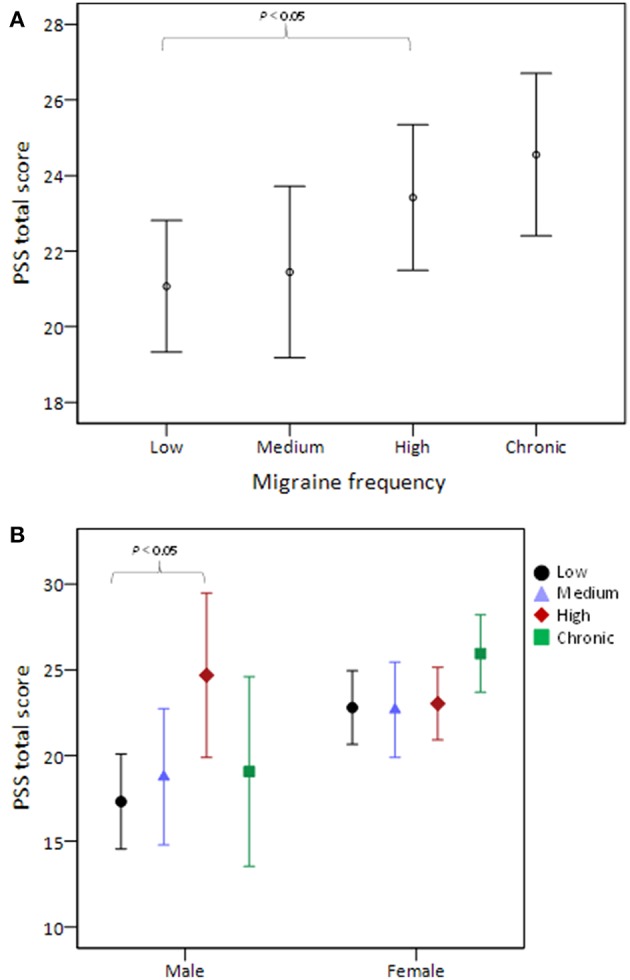
Figure 1.

PSS total score stratified by migraine frequency (A) and the comparison was further stratified by sex (B). The middle horizontal line represents the mean and the error bars represent 95% confidence interval around the means. PSS, Perceived Stress Scale.
