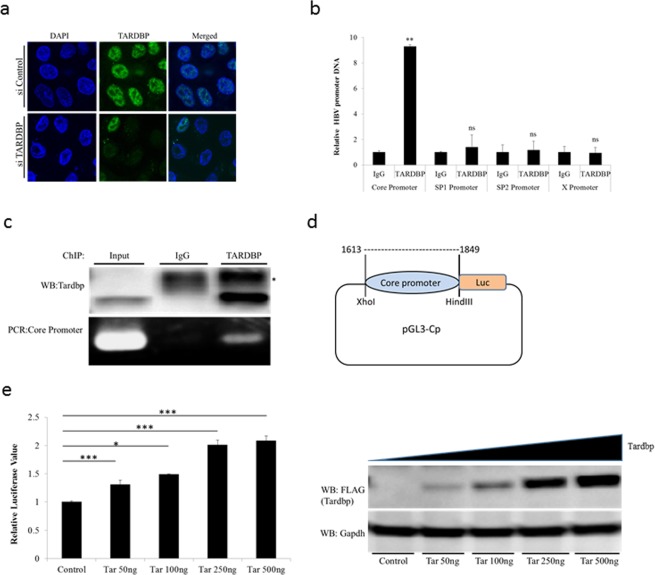
Figure 3.
TARDBP activates the HBV core promoter. (a) Endogenous TARDBP was detected by immunofluorescence of the HBV expressing cell line T23. The protein was visualized using the anti-TARDBP polyclonal antibody and anti-Rabbit IgG (Alexa Fluor® 488) secondary antibody. Cells were treated with control siRNA or siRNA specific to TARDBP to confirm specificity of the antibody. (b) The T23 cells were harvested at confluency and analyzed by ChIP assay using the antibody against TARDBP or the control rabbit IgG. Immunoprecipitated DNA was analyzed in triplicate by qPCR with primers specific for each of the HBV promoter DNA sequences (Core, Sp1, Sp2 and X). The results are displayed as the ratio of the amount of DNA bound to the TARDBP antibody to that bound to the control antibody, with the amount bound to the control antibody set to one. (c) To confirm precipitation of TARDBP and core promoter by the antibody, western blotting was performed using the TARDBP antibody, whereas the presence of core promoter DNA was detected by PCR using the core specific primers. The asterisk (*) indicates the location of the IgG heavy chain bands. (d) A schematic representation of the luciferase reporter plasmid pGL3-Cp that contains the luciferase reporter whose expression is controlled by the core promoter. (e) The pGL3-CP plasmid was co-transfected with the control vector pcDNA3.1/FLAG or increasing concentrations of pcDNA3.1/TARDBP-FLAG into NTCP-HepG2 cells as indicated. The pRL-TK plasmid, which expresses Renilla luciferase, was also included to monitor the transfection efficiency. Cells were lysed at 48 hours after transfection for the luciferase assay. Firefly luciferase values were normalized with control Renilla luciferase activity. The results are expressed as relative luciferase value, which refers to differences (n-fold) from the control value, which is set at one. The protein expression of TARDBP in the lysates was confirmed by western blotting using the anti-FLAG antibody. Error bars represent the SD of three independent experiments. *P < 0.05, **P < 0.01, ***P < 0.001 and ns-non significant.

