Figure 4.
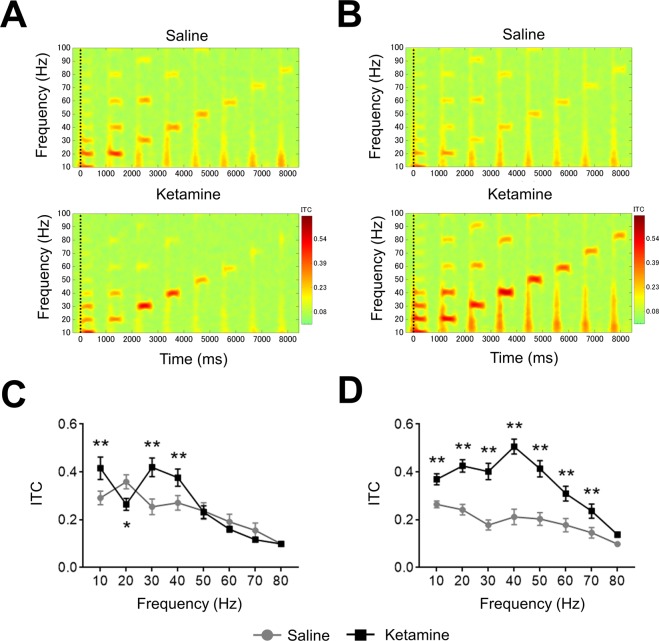
The effect of ketamine on ITC from temporal cortex recording. (A) The time-frequency plots of ITC at 1st recording (0–30 min) after saline (top) and ketamine (bottom) administration. (B) The time-frequency plots of ITC at 2nd recording (70–100 min) after saline (top) and ketamine (bottom) administration. In time-frequency plots, warmer color (reds, yellows) indicate higher ITC. (C) The ITC (10–80 Hz) at 1st recording after saline (circle line) and ketamine (square line) administration. (D) The ITC (10–80 Hz) at 2nd recording after saline (circle line) and ketamine (square line) administration. Data represent mean ± SEM (n = 16). *p < 0.05, **p < 0.01, significant differences between the groups; two-way repeated measures ANOVA followed by Bonferroni multiple comparison test.

