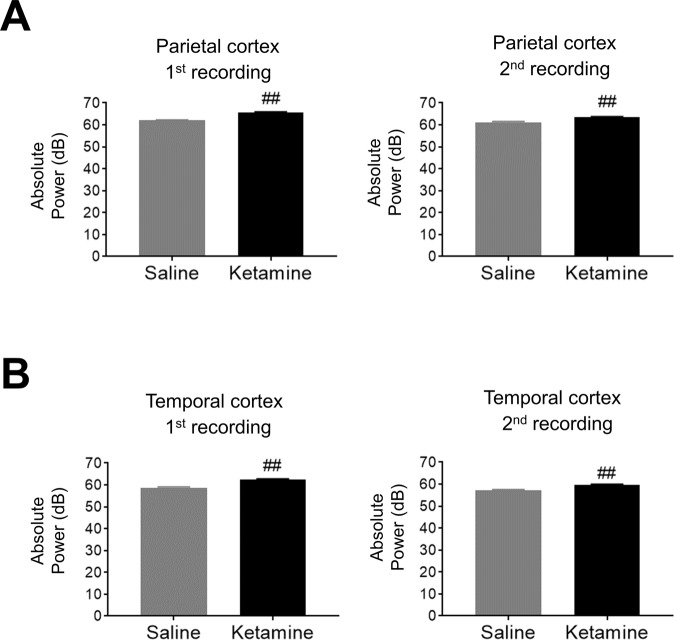
Figure 6.
The effect of ketamine on basal power of gamma frequency bands (30–80 Hz). (A) The absolute low gamma power (30–80 Hz) at 1st recording or 2nd recording after saline (left) or ketamine administration (right) in parietal cortex. (B) The absolute low gamma power at 1st recording or 2nd recording after saline (left) or ketamine administration (right) in temporal cortex. Data represent mean ± SEM (n = 15–16). ##p < 0.01, significant differences between the groups; paired t-test.

