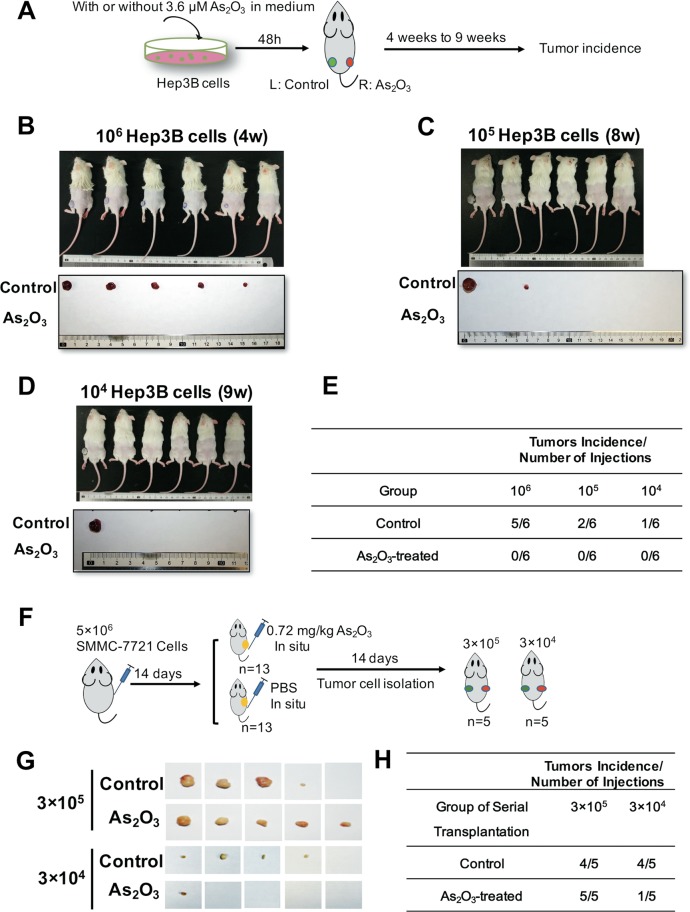
Fig. 3. ATO inhibits HCC tumorigenic capacity.
a A schematic diagram for examination of the effects of ATO on tumorigenic capacity of Hep3B cells. Subcutaneous injection of the Hep3B cells into NOD/SCID mice 48 h after HCC cells pre-treated with 3.6 μM ATO in 10% H-DMEM medium (HD). After 1 month, the peeled tumors were measured for size and weight. b–d Gross observation of tumor-bearing mice (top), peeled tumors (bottom), derived from Hep3B cells at 106, 105, and 104 dilutions, respectively. e Tumor incidence of the cells from each group in diluting limitation assay. f A schematic diagram for examination of the effects of ATO on tumorigenic capacity of HCC cells via serial transplantation. ATO was given by local injection into the subcutaneous tumors of the nude mice every other day (100 μL) with the same volume of PBS as the control. After 2 weeks, the tumors were carefully removed and digested into single cells by the collagenase, which were then subcutaneously injected into the NOD/SCID mice. g Gross observation of the peeled tumors from each group. h Tumor incidence of the cells from each group in serial transplantation assay

