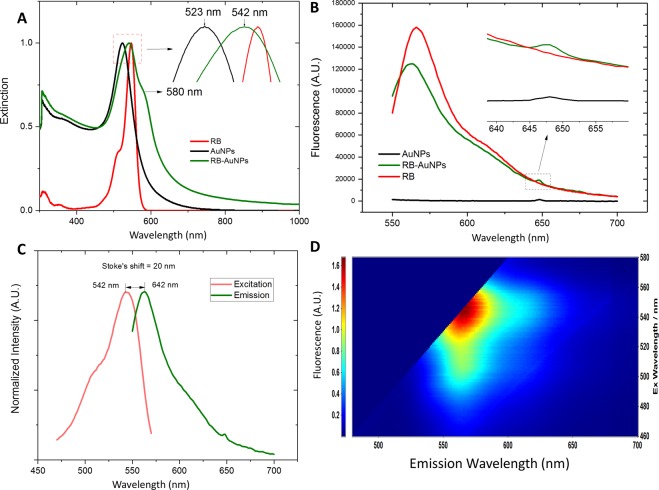
Figure 3.
Optical characterizations of the RB-AuNPs. (A) Extinction spectra of RB, AuNPs and RB-AuNPs, (B) Emission spectra of RB, AuNPs and RB-AuNPs under 530 nm excitation, (C) excitation-emission spectrum of RB-AuNPs, the excitation spectrum was obtained at a fixed emission of 590 nm, and (D) Emission map of RB-AuNPs, plotted by setting the x-axis as emission wavelength and y-axis as excitation wavelength. The color represents the relative peak intensity of emission.

