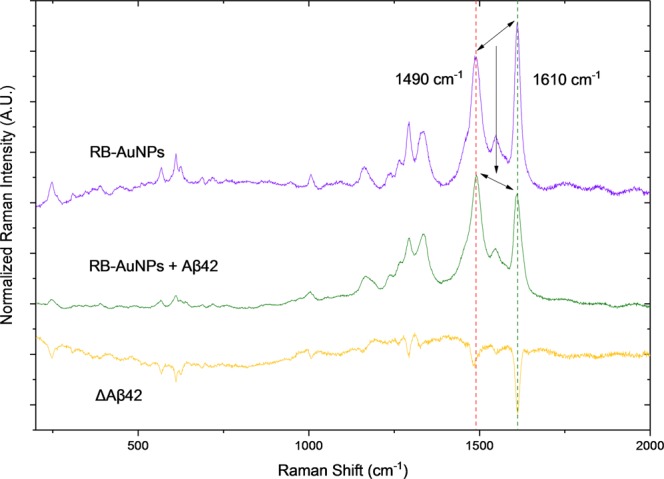
Figure 8.

Aβ42 induced spectra changes of RB-AuNPs. The normalized Raman spectra of the RB-AuNPs before (violet) and after (green) the addition of Aβ42 peptides (2 μM) show a considerable change in the relative magnitude of the signals from the two major peaks. The orange curve is obtained by digital subtraction. of the (RB-AuNPs) spectrum from the (RB-AuNPs + Aβ42) spectrum. Prior to the subtraction, both spectra were normalized using the standard score method.
