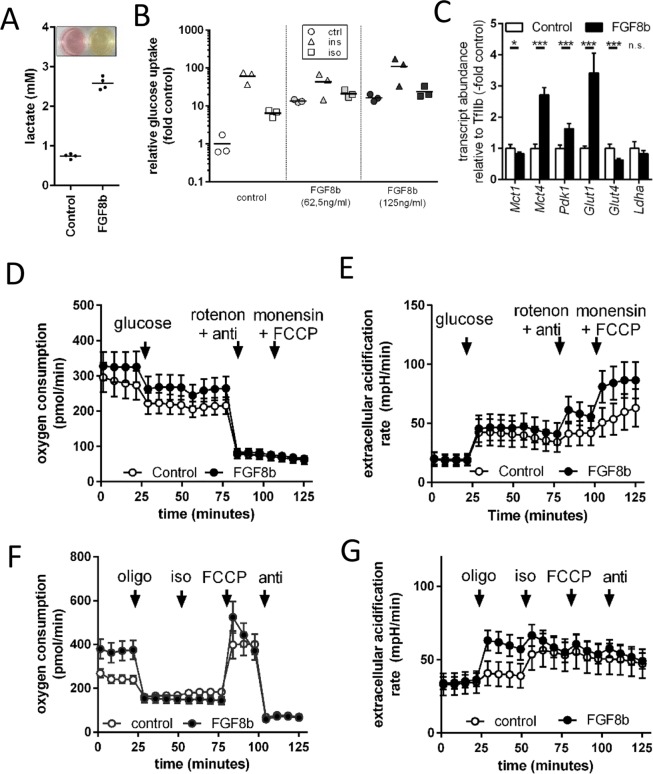
Figure 2.
Metabolic alterations in Fgf8b treated adipocytes. (A) Adipocytes were treated with 125 ng/ml FGF8b or not (control). Depicted are lactate concentration and medium colour of treated versus untreated cells at the end of a six day differentiation course and 48 hours after a medium change. (B) Relative glucose uptake was measured in untreated (control) or Fgf8b treated (62.5 ng/ml and 125 ng/ml, respectively) adipocytes in response to insulin (ins, 20 nM, 10 min) or isoproterenol (iso, 500 nm, 10 min), n = 3. (C) Transcript abundance of genes associated with glycolysis. Lactate exporters monocarboxylate transporter 1 and 4 (Mct1, Mct4) as well as pyruvate dehydrogenase kinase 1 (Pdk1) and glucose transporter 1 (Glut1) were increased by Fgf8b treatment, while glucose transporter 4 (Glut4) was downregulated. Lactate dehydrogenase (Ldha) remained unchanged, n = 5, *p < 0.05, ***p < 0.001, Holm-Sidak multiple test. (D) Oxygen consumption of differentiated adipocytes treated for 24 hours with 125 ng/ml Fgf8b and measured in initially glucose free medium. Injections are indicated by arrows in this order: 10 mM glucose, 1 µM rotenone plus 5 µM antimycin A (anti), 400 µM monensin plus 2 µM FCCP. Shown are mean values ± SD n = 12–18. E Extracellular acidification rate of the experiment shown in (D). (F) Oxygen consumption of differentiated adipocytes treated for 5 days with 125 ng/ml Fgf8b and measured regular assay medium (25 mM glucose). Injections are indicated by arrows in this order: 5 µM oligomycin (oligo), 1 µM isoproterenol (iso), 7.5 µM FCCP, 5 µM antimycin A (anti). Shown are mean values ± SD, n = 30. (G) Extracellular acidification rate of the experiment shown in (F).

