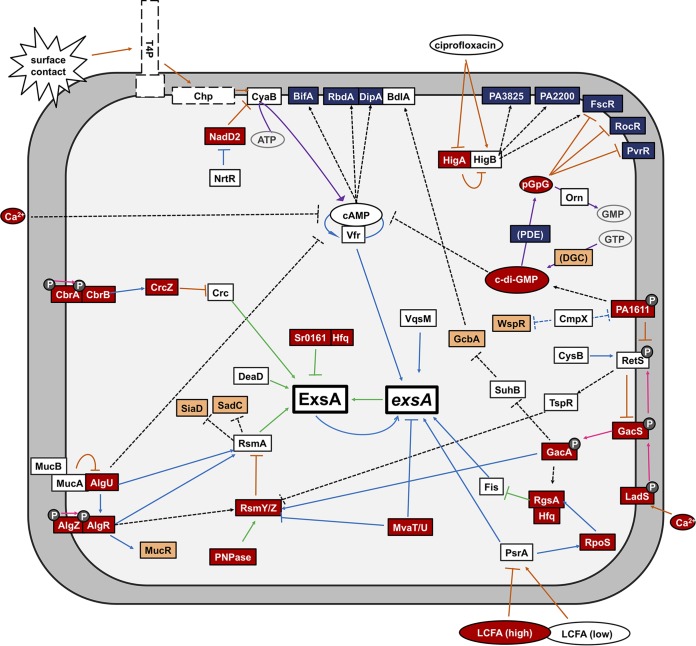
FIG 3.
Regulatory pathways that control T3SS gene expression. Gene products that stimulate T3SS gene expression are shown in white, while those that inhibit are red. Diguanylate cyclases (DGC) that synthesize c-di-GMP are orange, and phosphodiesterases (PDE) that degrade c-di-GMP are blue. P indicates a histidine kinase or response regulator. Blue lines signify transcriptional regulation, green lines signify posttranscriptional regulation, orange lines signify control of protein activity, purple lines signify enzymatic activity, pink lines signify phosphotransfer activity, and black dashed lines are links with indirect or unknown mechanisms.

