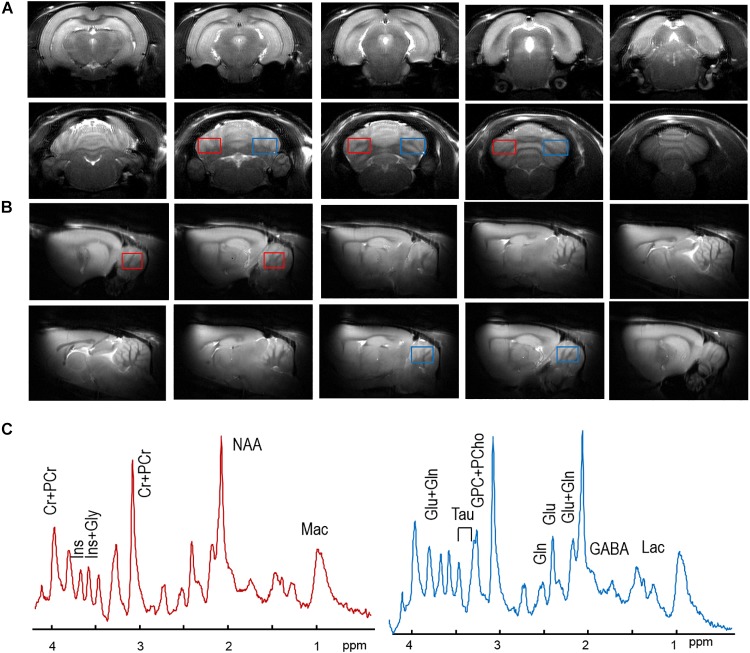
FIGURE 1.
Typical axial (A) and sagital (B) MR images, and one of each spectrum from the right cerebellum (red boxes) and the left cerebellum (blue boxes) in and (B) of one SH rat. In panel (C), no visual difference was observed between the right cerebellar spectrum (in solid red line) and the left one (in solid blue line). No visual differences in MR spectra were observed. Major metabolic resonances were highlighted along with their abbreviations, as listed in the Section “Materials and Methods.”

