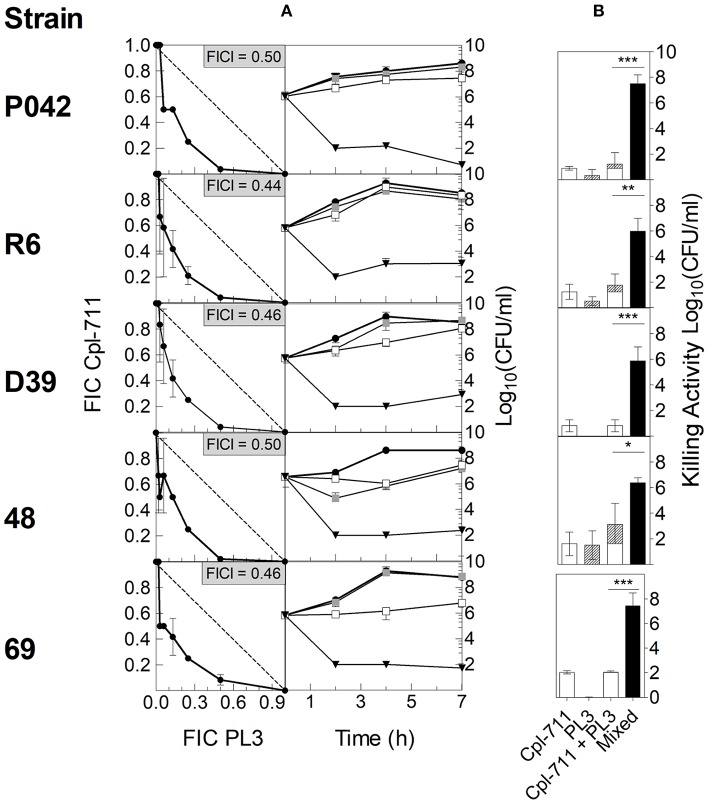
Figure 2.
In vitro synergy testing of Cpl-711 and PL3 on pneumococcal cells. (A, left panel) Isobolograms of the checkerboard synergy testing method. In every panel, insets indicate FICI values for each strain. The dashed lines illustrate theoretical additive curves. (A, right panel) Time-killing assays treated with PB as control (black circles), with 0.25× MIC of Cpl-711 (white squares), with 0.25× MIC of PL3 (gray squares), or with a combination of 0.25× MIC of each enzyme (black triangles) for 7 h. Checkerboard and time-kill results are the results of at least three independent replicates. (B) Killing activity at 7 h of either 0.25× MIC of each enzyme added separately (Cpl-711, open bars; PL3, hatched bars) or 0.25× MIC of each enzyme added simultaneously (black bars). A statistical comparison by t-test was performed between the sum of the effects of the two enzymes added separately (third bar, which is the sum of the two previous bars) and the effect of the mixed enzymes treatment (fourth bar) (*P < 0.05; **P < 0.01; ***P < 0.001).

