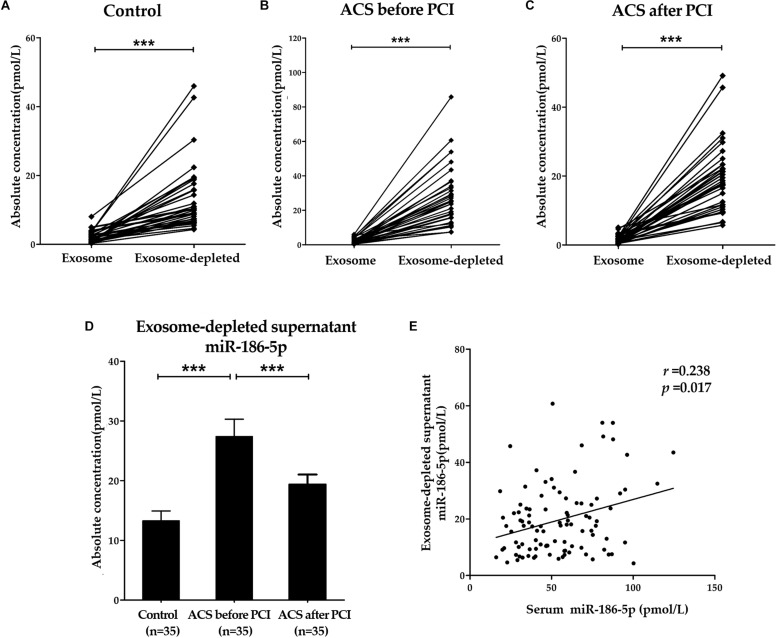
FIGURE 3.
Predominant form of serum miR-186-5p. (A–C) Absolute concentrations of miR-186-5p in exosome fractions and exosome-depleted supernatants from serum samples of controls and ACS patients. Each point represents the mean of triplicate samples. (D) Comparison of absolute concentrations of miR-186-5p in exosome-depleted supernatants from serum samples of controls and ACS patients. (E) Correlations between relative miR-186-5p levels in total serum samples and absolute miR-186-5p concentrations in exosome-depleted supernatants (r = 0.238, p = 0.017). ∗∗∗p < 0.001.

