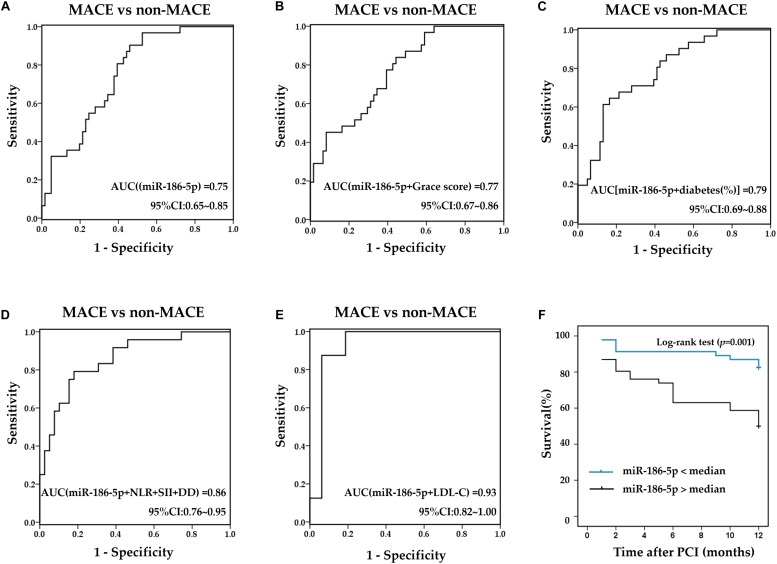
FIGURE 5.
Prognostic values of serum miR-186-5p and clinical markers. (A) ROC curves for serum miR-186-5p. (B–E) ROC curves for the combination of miR-186-5p with clinical markers (B) Combination of miR-186-5p with Grace scores, (C) combination miR-186-5p with proportions of diabetes, (D) combination miR-186-5p with NLR, SII and DD, (E) combination of miR-186-5p with LDL-C to predict the occurrence of one-year MACE. (F) Kaplan Meier survival curves stratified by miR-186-5p levels in ACS patients undergoing PCI.

