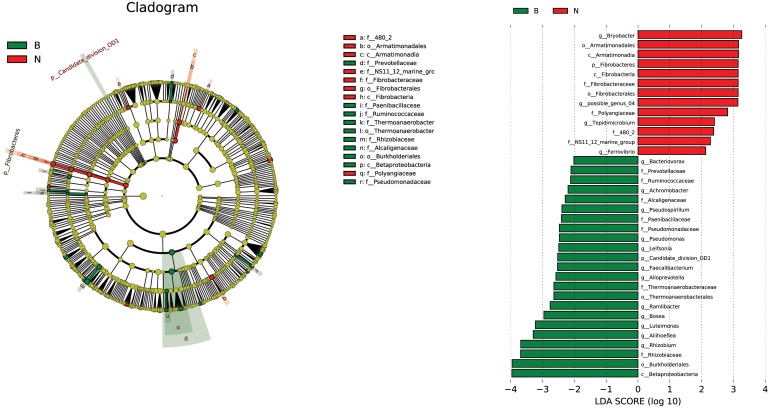
FIGURE 11.
Linear discriminant analysis (LDA) effect size taxonomic cladogram highlighting the microbial biomarkers that statistically and biologically differentiated each group and depicting operational taxonomic units with absolute LDA score log10 > 2. B represents all the treatments inoculated with Cra20, N represents all the treatments of non-inoculation. Significant (red and green) and non-significant (yellow) discriminant taxonomic nodes are colored. The circle diameter is proportional to the taxon abundance, and each ring represents a taxonomic level in order from the center to the periphery: phylum, class, order, family, and genus.

