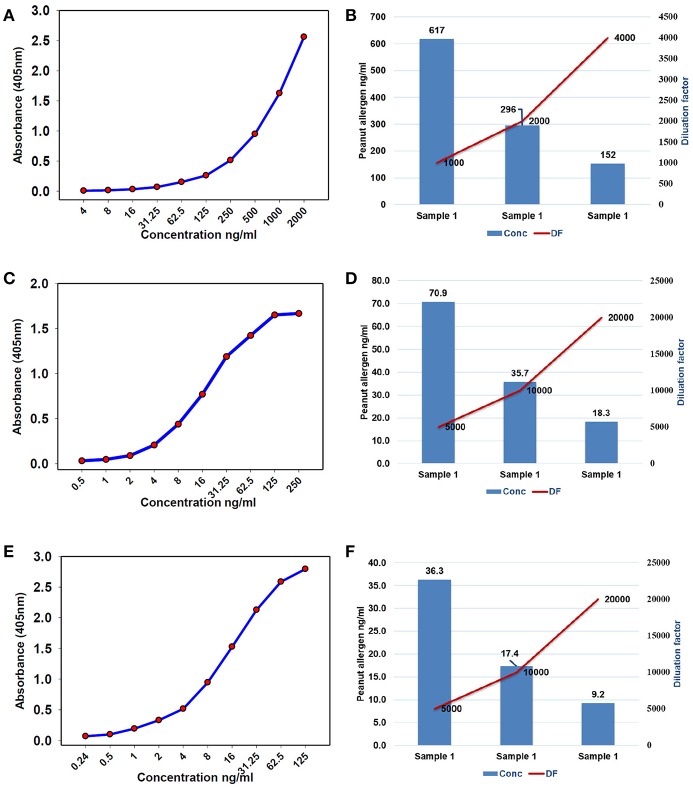
Figure 3.
Standard curve and optimized dilutions for Ara h 1, Ara h 2, and Ara h 3 allergens in peanut seeds. (A) standard curve for Ara h 1 allergen and (B) standardization of dilution factor to estimate Ara h 1. (C) standard curve for Ara h 2 allergen and (D) standardization of dilution factor to estimate Ara h 2. (E) standard curve for Ara h 3 allergen, and (F) standardization of dilution factor to estimate Ara h 3.

