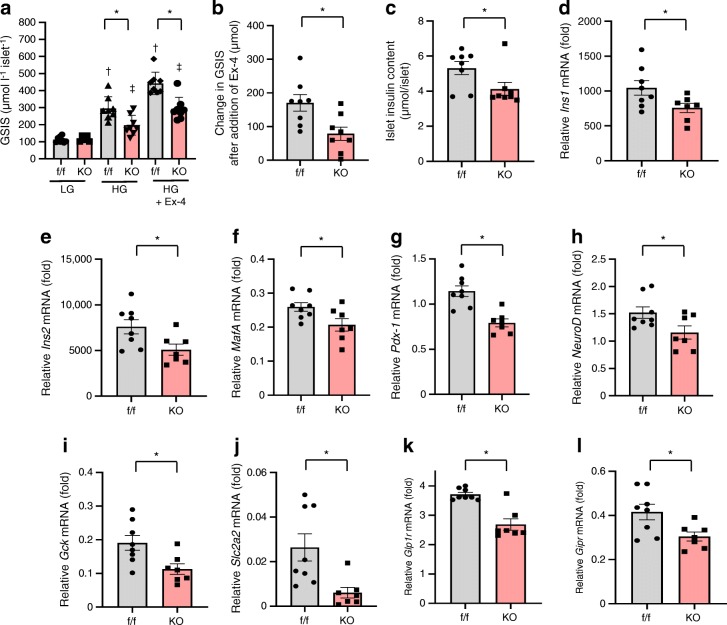
Fig. 2.
GSIS of isolated islets and mRNA expression levels related to insulin, its biosynthesis and beta cell function. (a) GSIS of isolated islets from control flox and VE-PDPK1-KO mice (n=8 mice), in 3.3 mmol/l glucose (low glucose, LG) and 16.7 mmol/l glucose (high glucose, HG), without and with addition of 10 nmol/l Ex-4. (b) Change in GSIS after addition of Ex-4 in HG (n=8 mice). (c) Islet insulin content (n=8 mice). (d–l) Expression levels of mRNA (reported as fold vs β-actin) related to insulin biosynthesis (d–h) and beta cell function (i–l) (n=7 or 8 mice, as indicated). Values are the means ± SEM. *p<0.05, KO vs f/f; †p<0.05 vs LG f/f; ‡p<0.05 vs LG KO. f/f, control flox mice; HG, high glucose (16.7 mmol/l); KO, VE-PDPK1-KO mice; LG, low glucose (3.3 mmol/l)

