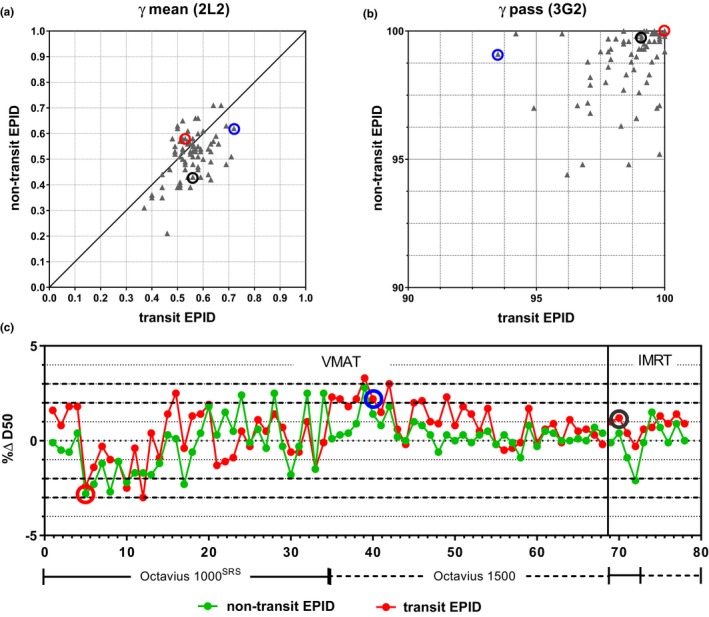
Figure 4.

Scatter plots displaying results of the direct comparison between 3D dose distributions reconstructed with Octavius 4D and the corresponding 3D dose distributions reconstructed with transit and non‐transit EPID dosimetry using (a) 2L2 γ‐mean values, (b) 3G2 γ‐pass rate values, and (c) percentage difference in median dose to the high dose volume %ΔHDVD 50 (Octavius 4D used as reference). The VMAT cases in (c) are arranged in increasing order of analyzed volume. The circled data points correspond to a 6MV head‐and‐neck VMAT plan that showed the largest 2L2 γ‐mean value (blue), to a 6MV FFF VMAT stereotactic brain plan that presented one of the largest deviations in HDVD 50 (red) and to a 10MV IMRT lung case (black).
