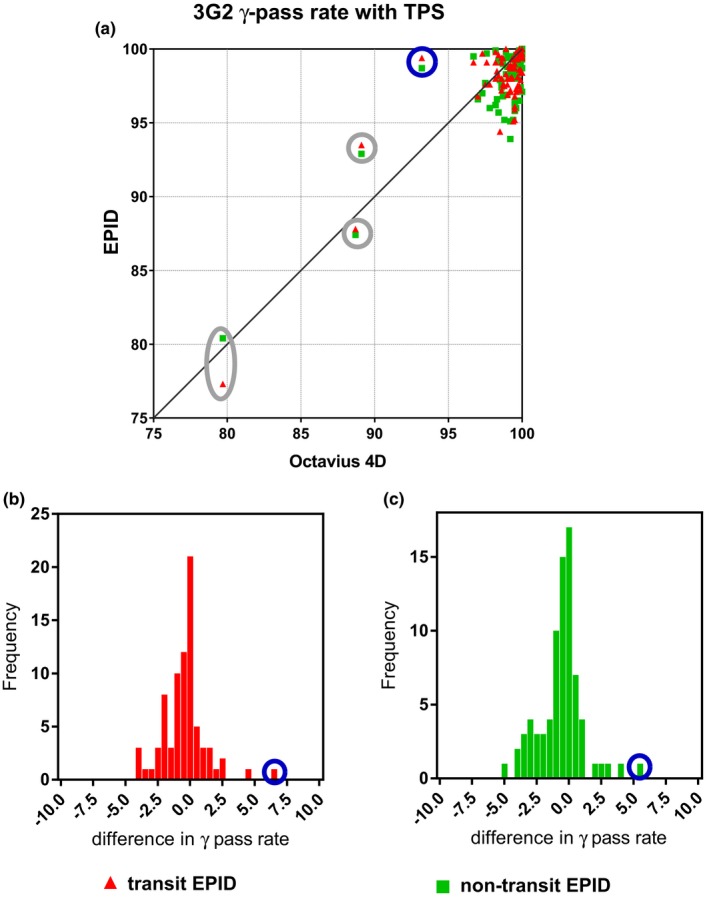
Figure 6.

(a) Scatter plots comparing the agreement between dose distributions reconstructed with EPID dosimetry and the Octavius 4D system and the corresponding planned dose distributions in terms of 3G2 γ‐pass rate values and (b,c) histograms of differences in TPS comparison results between EPID dosimetry and Octavius also expressed in terms of 3G2 y pass rate values.
