Figure 5.

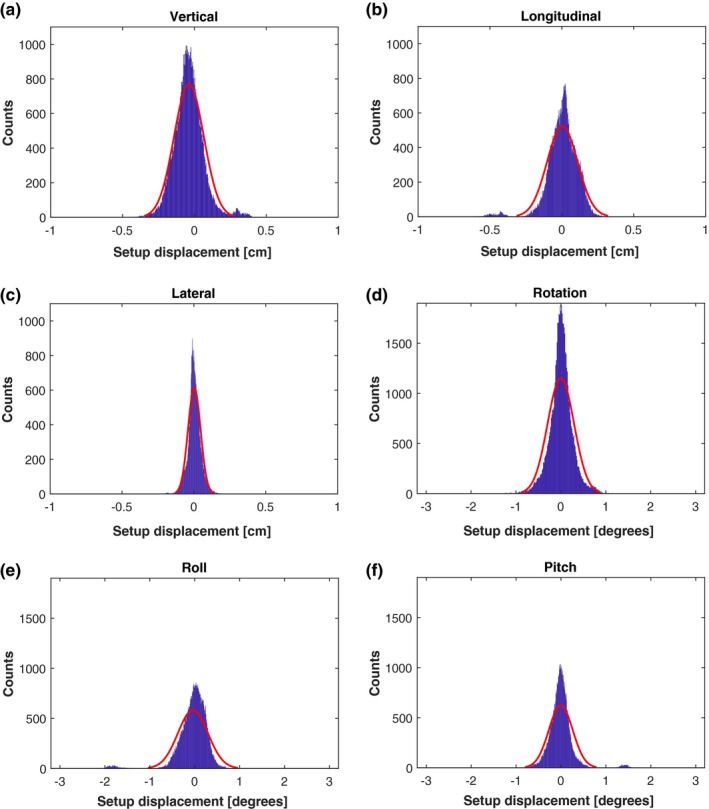
The intrafractional motion of all patients during 99 fractions in all six degrees of freedom. The red curve represents a normal distribution fit

The intrafractional motion of all patients during 99 fractions in all six degrees of freedom. The red curve represents a normal distribution fit