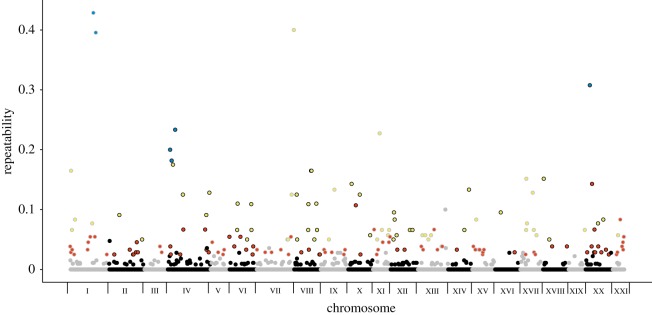
Figure 1.
Magnitude of repeatability across genomic windows. Each dot represents a 50 kbp window; alternating grey and black lines around the dots indicate separate chromosomes. Red coloration within the dot indicates outliers that were shared across three population pairs, yellow indicates outliers that were shared across four to six population pairs and blue indicates outliers that were shared across 7–10 population pairs. Grey or black coloration within the dot indicates outliers that were either unique to a single population pair or only shared between two population pairs.

