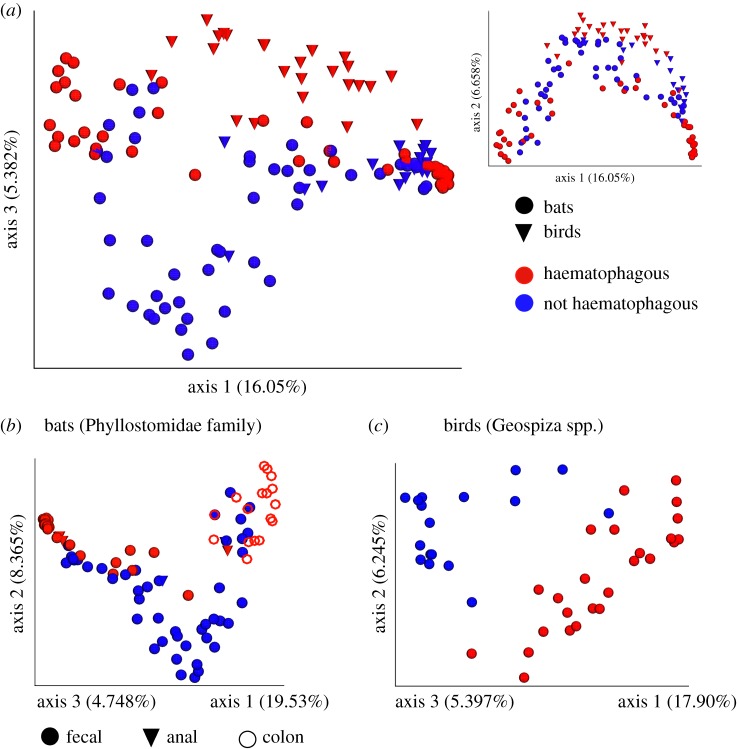
Figure 2.
Principal coordinate analysis (PCoA) plots of the unweighted UniFrac distance among samples from haematophagous (red) and non-haematophagous (blue) species. PCoA ordination of distances among all bat and bird samples are shown in (a), with axes 1 and 3 in the larger image showing stratification between haematophagous and non-haematophagous animals, and axes 1 and 2 in the smaller inset. Separate ordinations for bats and birds are shown in (b,c), respectively. In bats, the different sample types collected are also indicated.

