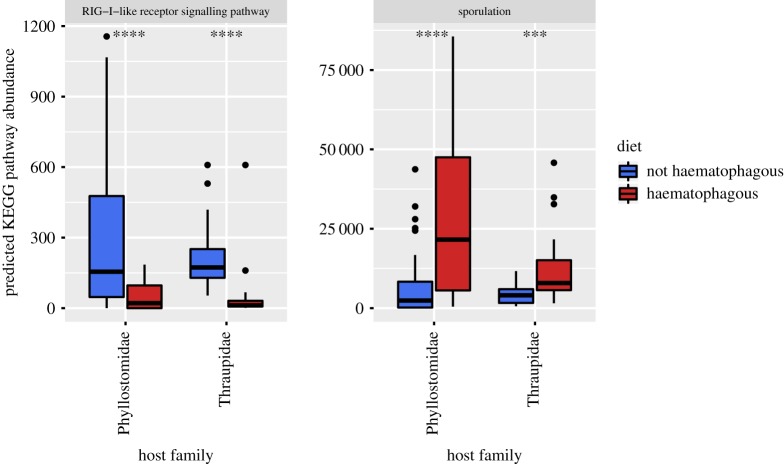
Figure 6.
Boxplots show the KEGG pathways detected as differentially abundant between both pairs of haematophagous (red) and non-haematophagous (blue) species. Stars above the paired boxplots indicate the level of significance when means are compared using a Wilcoxon test (****p < 0.00005; ***p < 0.0005).

