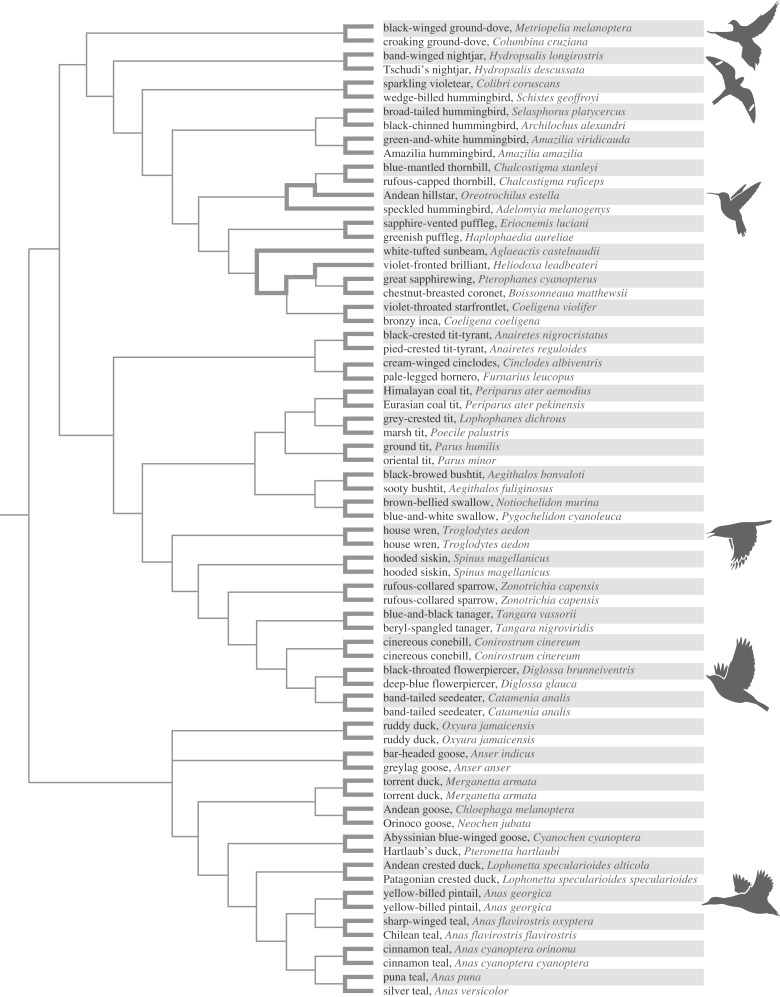
Figure 1.
Phylogenetic relationships of 70 avian taxa used in comparative analyses of Hb function. Rows corresponding to high-altitude taxa are shaded. Branches in bold connect pairs of high- and low-altitude taxa that were used to test for a relationship between Hb–O2 affinity and native elevation. The 35 pairwise comparisons are phylogenetically independent. For information regarding elevational ranges, see [25–29,33].

