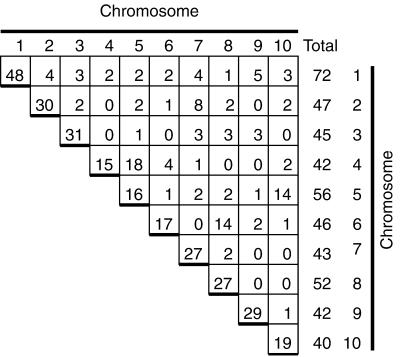
Figure 4.
Summary of mapping EST and STS sequences. Results from mapping 300 EST and 50 STS markers are tabulated. The column of numbers at the far right of the figure give the total number of markers mapped to each chromosome, whereas the numbers on the diagonal gives the number of unique markers mapped to each chromosome. For example, a total of 72 markers were mapped to chromosome 1; of these markers 48 of them were only present on chromosome 1. The number of markers that mapped to each pair of chromosomes is also shown. Chromosome pair 4 and 5 had 18 markers in common. The row and columns do not sum up to the chromosome totals because duplicated sequences are counted more than once. Data from five sequences are not included; each was found on five or more chromosomes.

