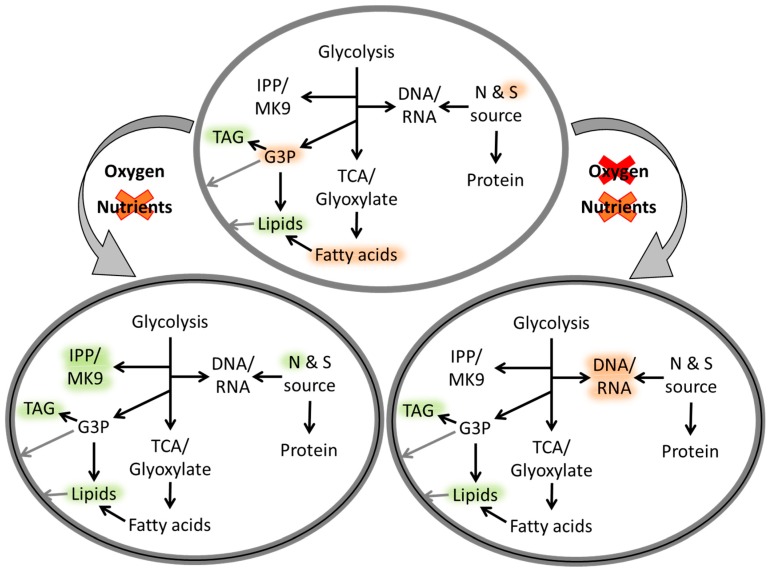
Figure 4.
Schematic representation of metabolic processes of mycobacterial cells under changes/depletion of oxygen and nutrients levels (grey curved arrows), adapted from Drapal, M.; et al. Microbiology 2016, 162, 1456–1467. Copyright © 2016 Microbiology Society [45]. Intracellular metabolic processes are indicated with black arrows and regulation highlighted as up (green) or down (red).

