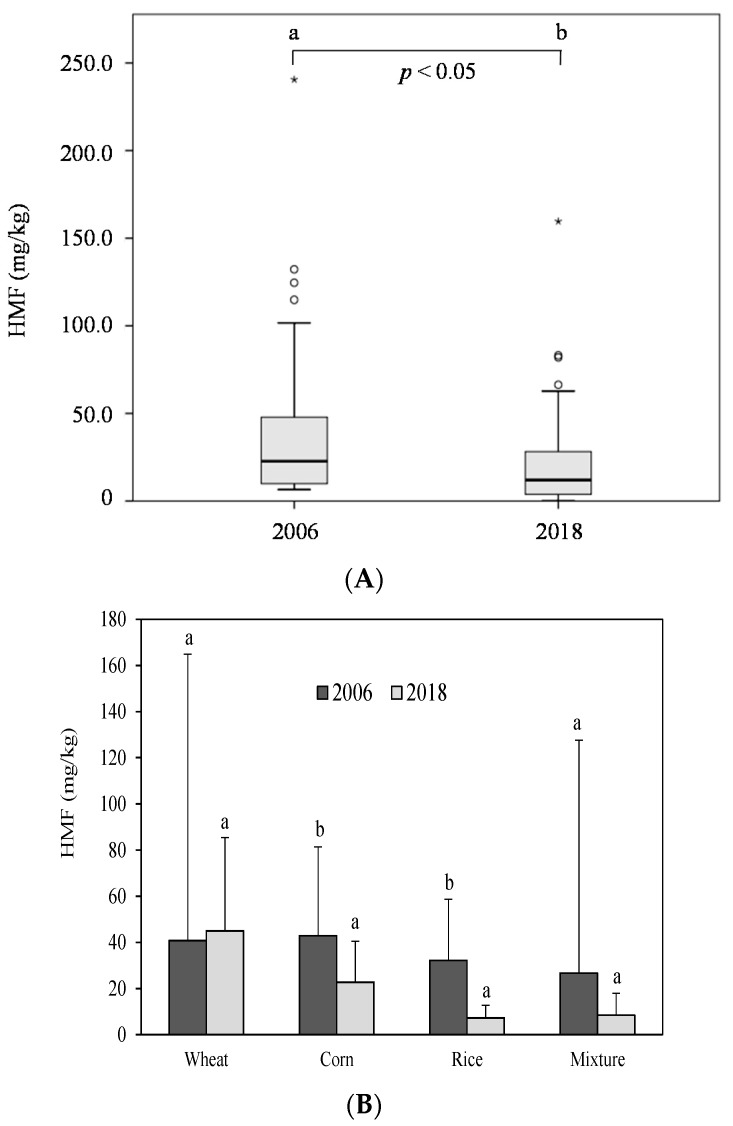
Figure 3.
(A) Box-and-whisker plot of global HMF content in breakfast cereals sampled in 2006 vs. 2018. Symbols: ∗ strong outlier; ◦ mild outlier (B) Comparison of the furosine and HMF content in breakfast cereals grouped according to the predominant cereal in 2006 vs. 2018. Different letters indicate significant differences between years (p < 0.05).

