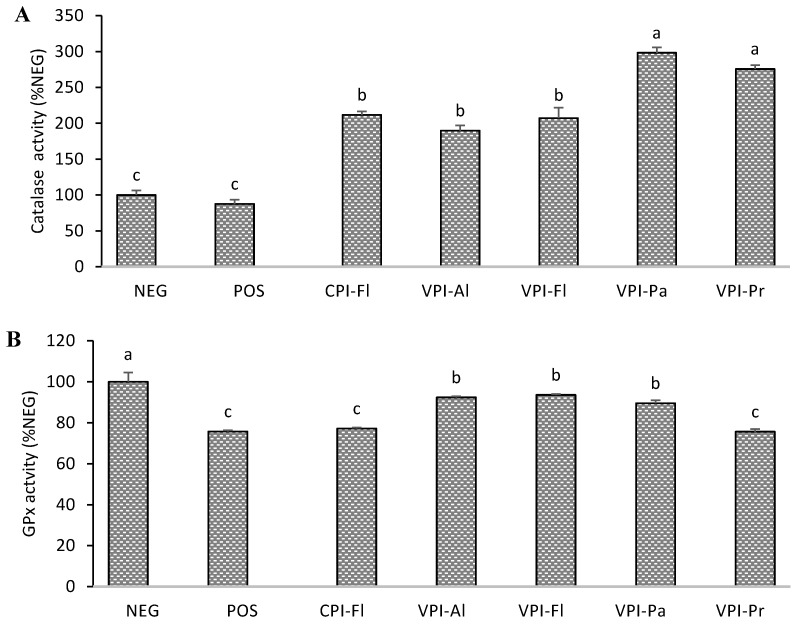
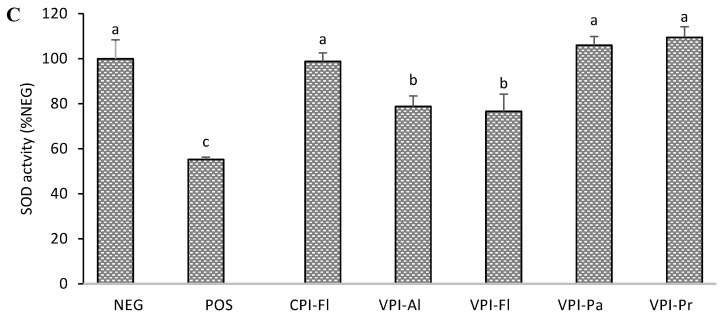
Figure 3.
Activity of the antioxidant enzymes in AAPH-stressed HepG2 cells of hydrolysates (100 µg/mL) that showed lower reactive oxygen species (ROS) and higher GSH/GSSG ratios. Catalase (A); glutathione peroxidase (B); superoxide dismutase (C). NEG: normal cells (no treatment); POS: positive control (AAPH treated only). Oat bran proteins extracted with Cellulase (CPI) or with Viscozyme (VPI) and then hydrolyzed with Alcalase (Al), Flavourzyme (Fl), Papain (Pa) or Protamex (Pr). Data with different letters showed significant difference (p < 0.05) from Duncan’s multiple range test (n = 3).


