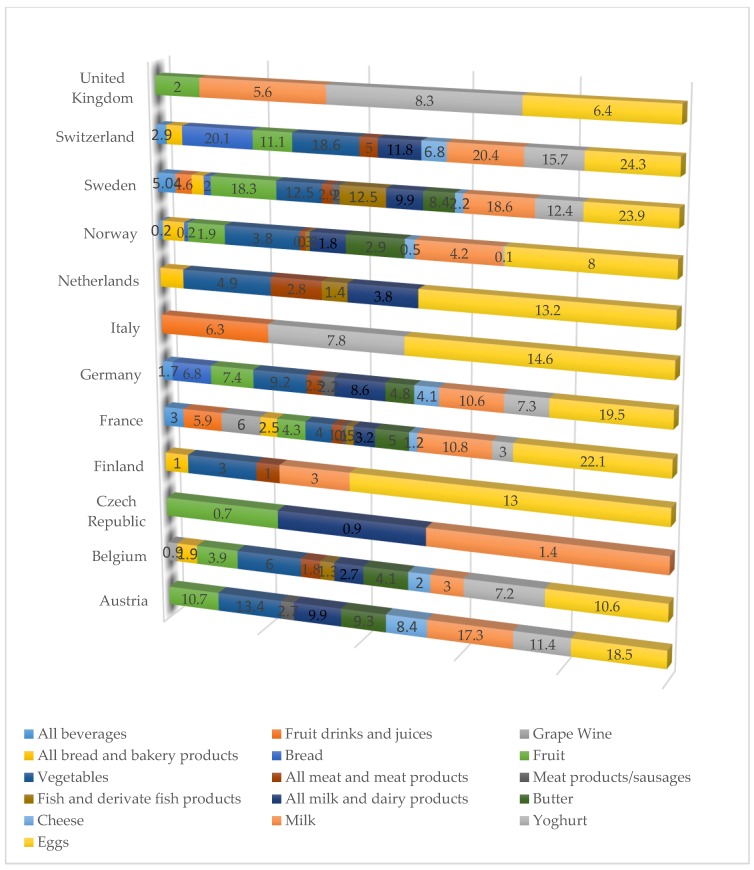
Figure 7.
Shares of organic products and product groups of their respective total markets for selected countries in 2015. Source: Austria: AMA Marketing, Belgium, LF based on GFK, Czech Republic: UZEI and experts estimates, Finland: Pro Luomu, France: Agence BIO; Germany: Agricultural market information Company based on GFK; Italy: Asso Bio based on Nielsen; Netherlands: Bionext; Norway: Nielsen Norway; Sweden: Statistics Sweden; Switerland: Bio Suisse; UK: Soil Association.

