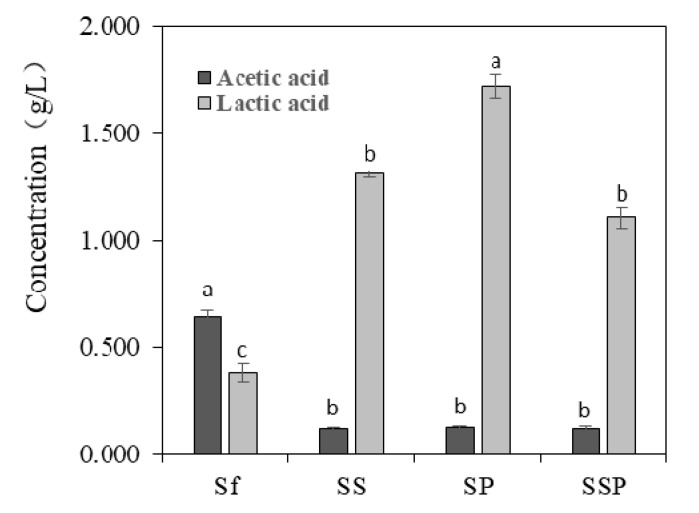
Figure 3.
The contents of acetic acid and lactic acid in different fermentation trials. The results shown are means of three replicates. The bars correspond to the estimated average levels. The error bars show standard errors of the mean values. Different letters represent significant difference (p < 0.05) of acetic acid or lactic acid content. Sf = Saccharomycopsis fibuligera 12, SS = Saccharomycopsis fibuligera 12/Saccharomyces cerevisiae 3, SP = Saccharomycopsis fibuligera 12/Pediococcus acidilactici 4, SSP = Saccharomycopsis fibuligera 12/Saccharomyces cerevisiae 3/Pediococcus acidilactici 4.

