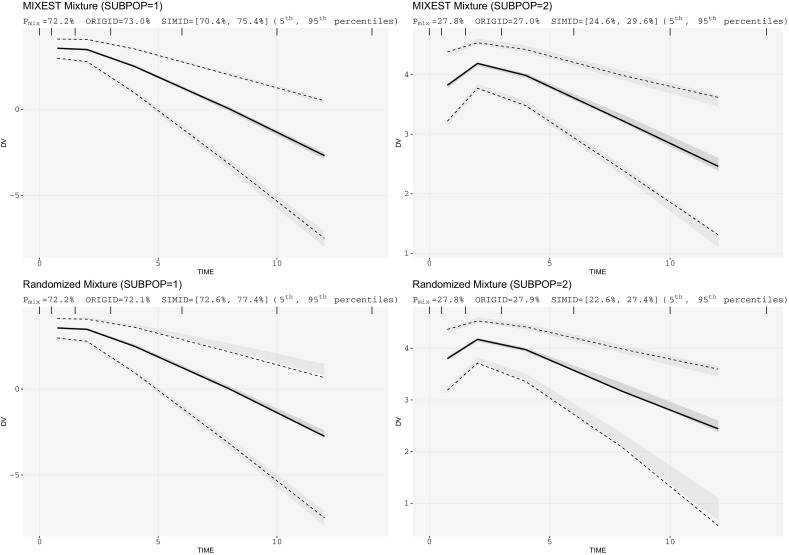
Fig. 2.

Mixture VPCs for linear PK data: upper panel displays MIXEST based VPCs while lower panel displays IPmix based VPCs. One-compartment mixture model with 70/30% mixture proportions having fourfolds CL difference. (SUBPOP subpopulation number, Pmix estimated population proportion, ORIGID, SIMID individuals (%) allocated to respective subpopulations in original and simulated data respectively)
