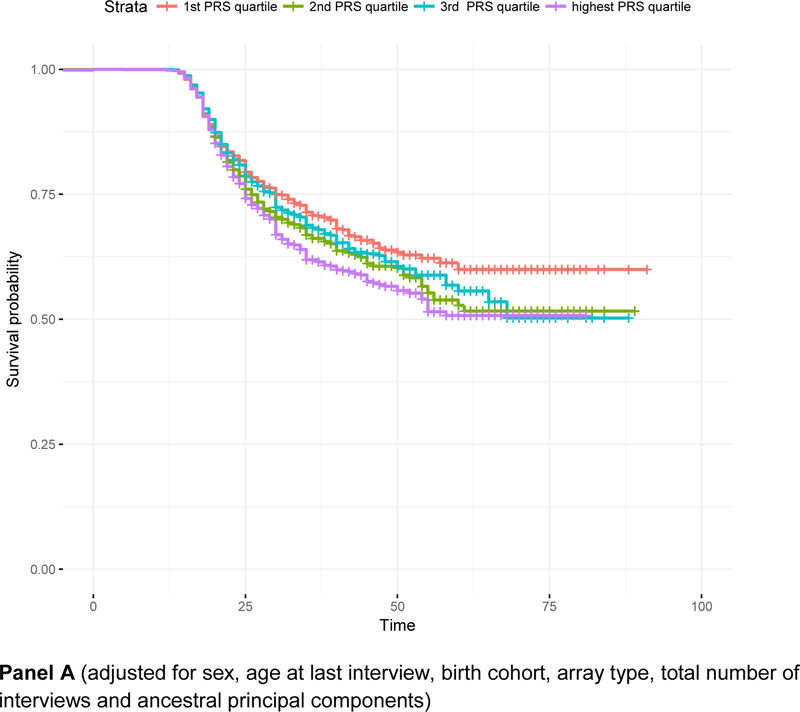
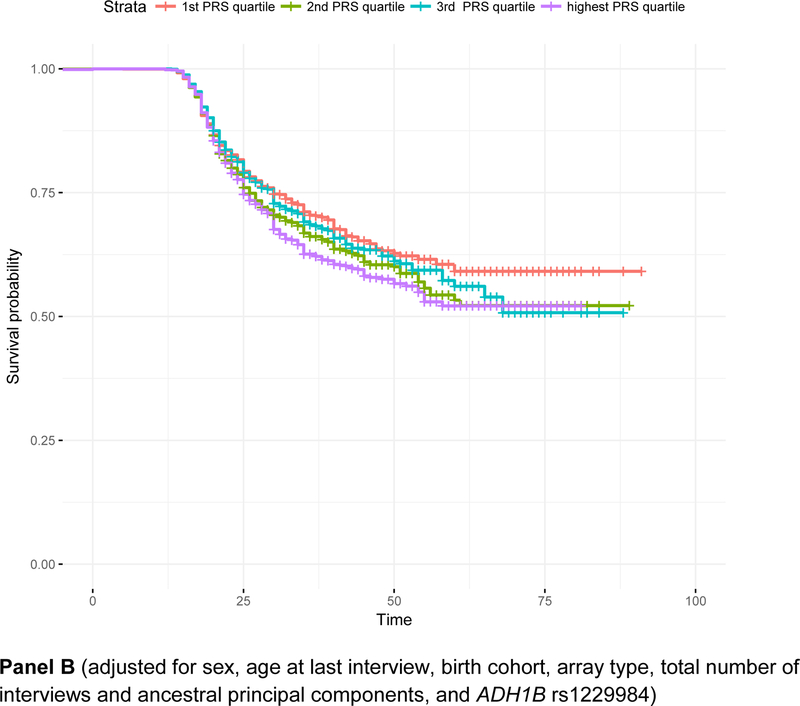
Figure 1. Survival curves representing the relationship between age of onset of alcohol dependence and quartiles of polygenic risk for alcohol consumption.
Panel A: survival curves adjusted for sex, age at last interview, birth cohort, array type, total number of interviews and ancestral principal components; Panel B: adjusted for covariates in Panel A as well as for rs1229984 in ADH1B. Panel A (adjusted for sex, age at last interview, birth cohort, array type, total number of interviews and ancestral principal components) Panel B (adjusted for sex, age at last interview, birth cohort, array type, total number of interviews and ancestral principal components, and ADH1B rs1229984)


