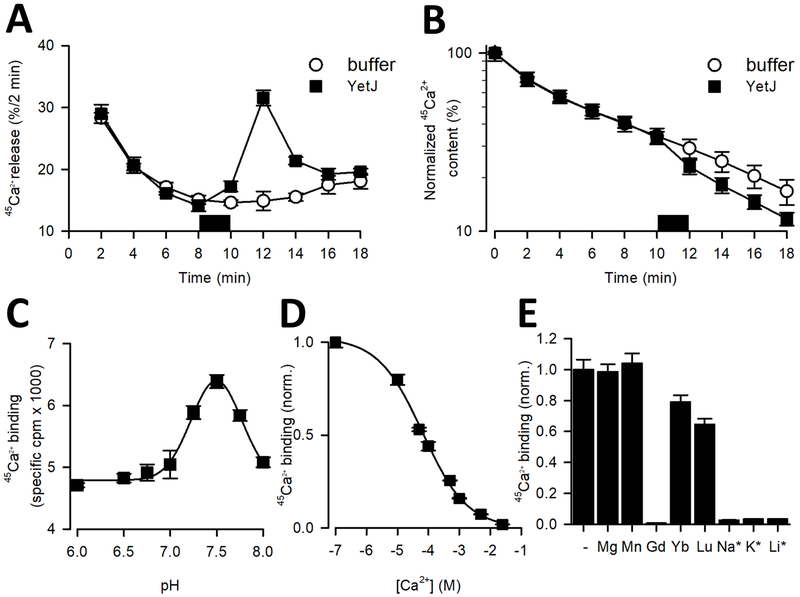
Figure 1. Ca2+ activity of BsYetJ.
(A-B) Ca2+ efflux mediated by BsYetJ. Permeabilized HeLa cells loaded to steady-state with 45Ca2+ were incubated in Ca2+-free efflux medium. 45Ca2+ release (% / 2 min) was plotted as a function of time (A) and normalized 45Ca2+ content (%) was plotted as a function of time (B). In the time period indicated by the dark square, buffer or BsYetJ (2.5 mM) was added for 2 min. Data from a typical experiment are represented as mean ± SD (n= 2; i.e. duplicate technical repeats). The graph is representative for 3 independent experiments. (C) pH dependence of 45Ca2+ binding. Binding of 10 μM 45Ca2+ (746 Ci/mmol) to 50 ng of BsYetJ was measured in assay buffer with a pH ranging from 6.0 to 8.0. Data were fit to a Gaussian model, revealing a peak at pH 7.46 ± 0.01. (D) Apparent affinity of Ca2+ binding by BsYetJ at pH 7.5. 10 μM 45Ca2+ binding was measured in the presence of increasing concentrations of non-labeled Ca2+, yielding an EC50 of 65.4 ± 0.9 μM. (E) Ion sensitivity of BsYetJ. 10 μM 45Ca2+ binding by BsYetJ was measured in the absence (−) or presence of 5 mM or 100 mM (*) of the indicated cations. Data are represented as mean ± SEM (n= 3).

