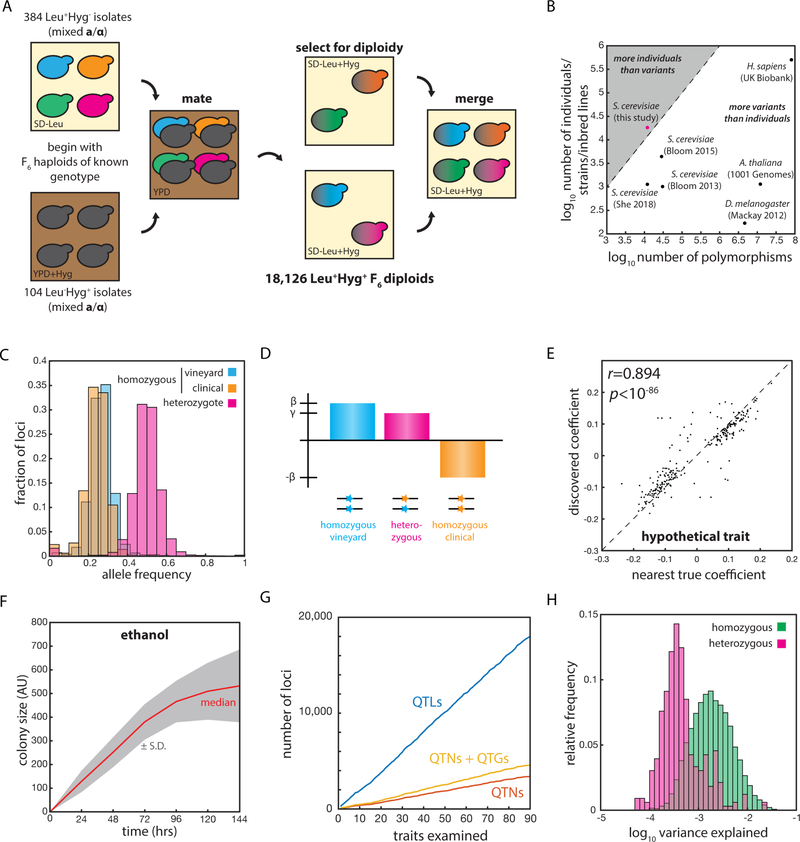
Fig. 1: An extremely large panel of fully genotyped diploid yeast to inventory complex heredity.
(A) Mating scheme used to construct the diploid segregant collection. (B) Number of segregating genetic variants and number of genotyped individuals in various mapping panels. (C) Relative frequencies of RM11 homozygotes (blue), YJM975 homozygotes (orange), and heterozygotes (magenta) across the 12,054 polymorphic loci in the panel. (D) Scheme illustrating the linear mixed model used to describe phenotype. β represents the homozygous locus effect and γ the heterozygous locus effect, if any. (E) Correlation (Pearson’s r) between effect size in the model and nearest true locus effect for an example simulated trait. (F) Growth of segregant panel on S-CSM + 2% ethanol solid medium. (G) Total number of QTLs, QTGs, and QTNs discovered with increasing number of quantitative traits examined. (H) Histogram of variance explained per QTL for linear (homozygous, green) and nonlinear (heterozygous, magenta) contributions across all 90 quantitative traits. See also Figure S1.

