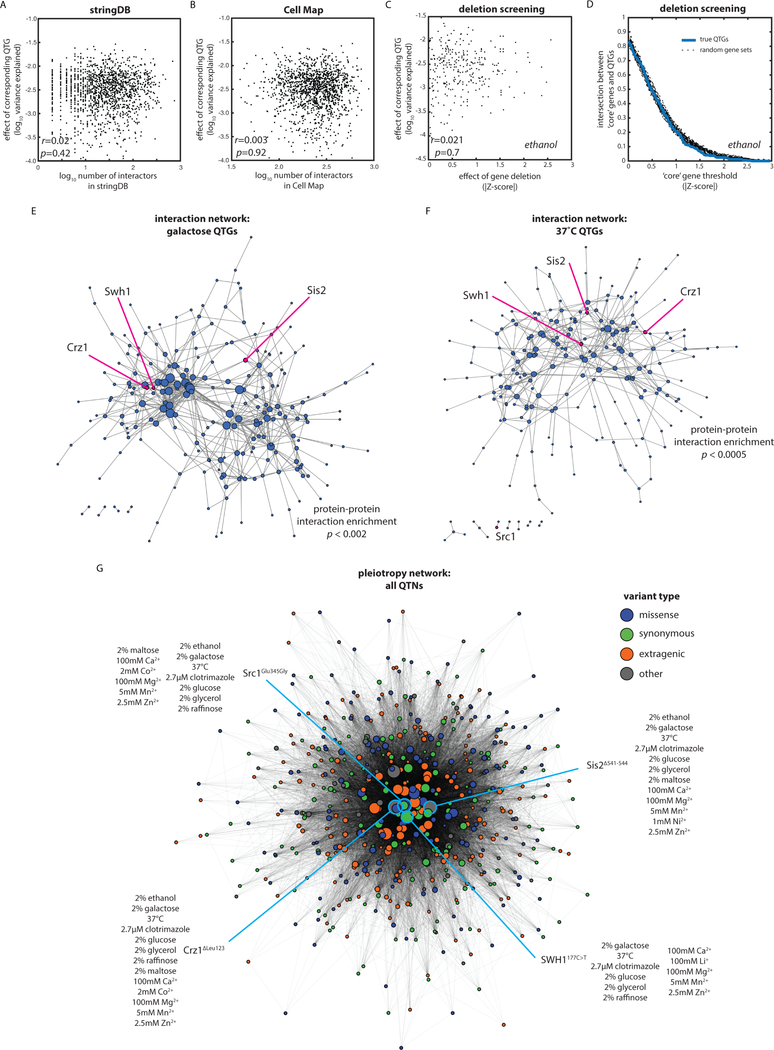
Fig. 4: The variant-to-phenotype map is distinct from other maps of cellular connectivity.
(A) QTG effect size as a function of (A) connectivity in STRING database, (B) connectivity in the Cell Map, and (C) gene deletion or DAmP allele effect. Correlations by Pearson’s r. (D) Enrichment of QTGs in core gene sets as defined by a sliding window of absolute Z-score of gene deletion or DAmP allele effect. Dashed lines show the same enrichment calculated for random gene sets of the same size. (E and F) Spring-embedded protein-protein interaction maps from STRING database for QTG in (E) galactose and (F) 37°C with edges weighted by interaction strength. Nodes are sized by interaction degree. Highlighted are key, highly pleiotropic genes. (G) Spring-embedded network representation of QTNs (nodes) connected by edges weighted by the number of traits in which the variants are jointly causal and colored by the type of molecular variation as indicated. Nodes sized by extent of pleiotropy of the QTN. Four key pleiotropic QTNs are highlighted in blue.

